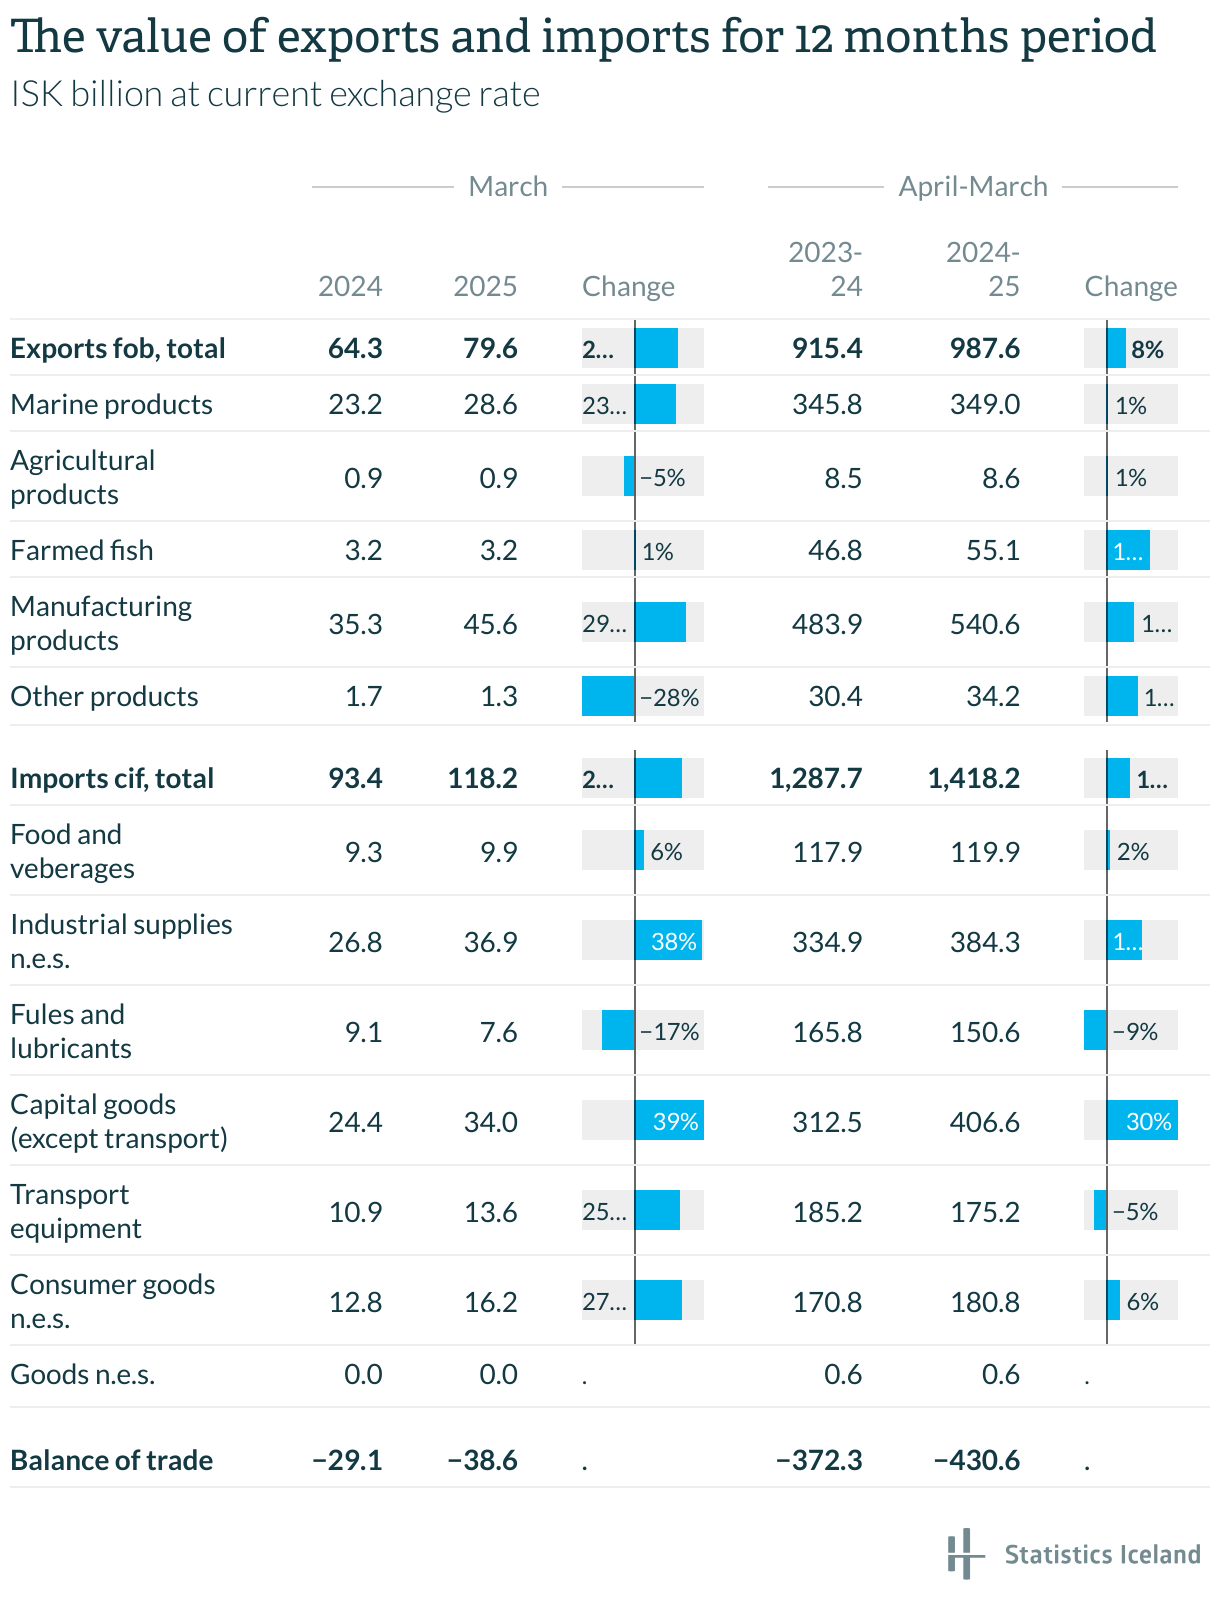
Table with 7 columns and 17 rows.
MarchApril-March
2025Change2023-242024-25Change
Exports fob, total64.379.6
24%
915.4987.6
8%
Marine products23.228.6
23%
345.8349.0
1%
Agricultural products0.90.9
−5%
8.58.6
1%
Farmed fish3.23.2
1%
46.855.1
18%
Manufacturing products35.345.6
29%
483.9540.6
12%
Other products1.71.3
−28%
30.434.2
13%
Imports cif, total93.4118.2
27%
1,287.71,418.2
10%
Food and veberages9.39.9
6%
117.9119.9
2%
Industrial supplies n.e.s.26.836.9
38%
334.9384.3
15%
Fules and lubricants9.17.6
−17%
165.8150.6
−9%
Capital goods (except transport)24.434.0
39%
312.5406.6
30%
Transport equipment10.913.6
25%
185.2175.2
−5%
Consumer goods n.e.s.12.816.2
27%
170.8180.8
6%
Goods n.e.s.0.00.0
.
0.60.6
.
Balance of trade−29.1−38.6
.
−372.3−430.6
.