•
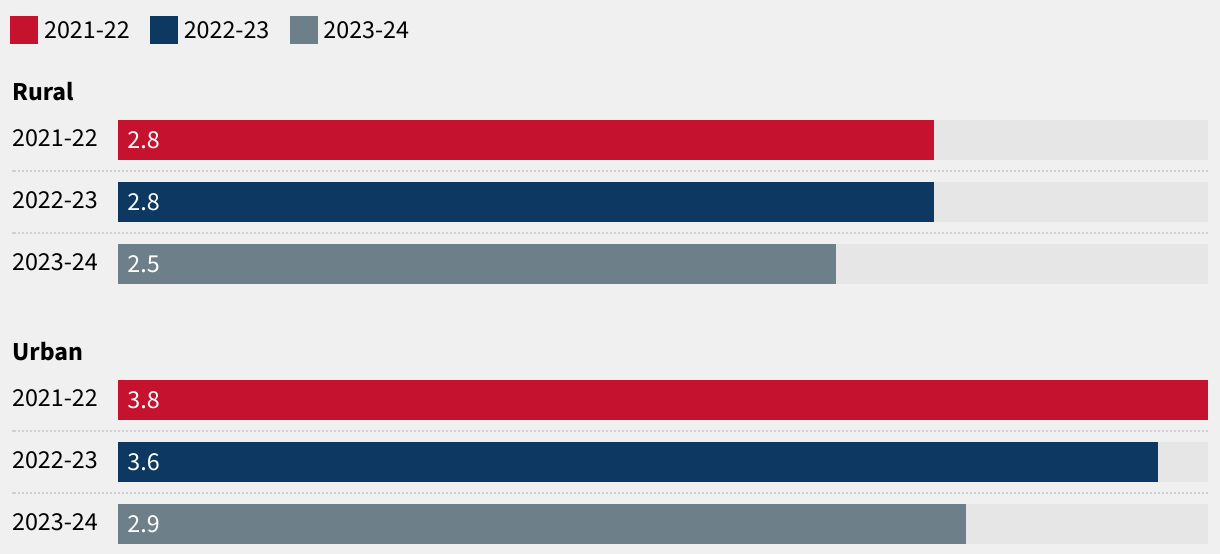
FIGURE 3
Proprietor gender ratio in non-agricultural unincorporated establishments by sector (2021–2023)
Ratios represent the number of male proprietors relative to one female proprietor
Ratios represent the number of male proprietors relative to one female proprietor