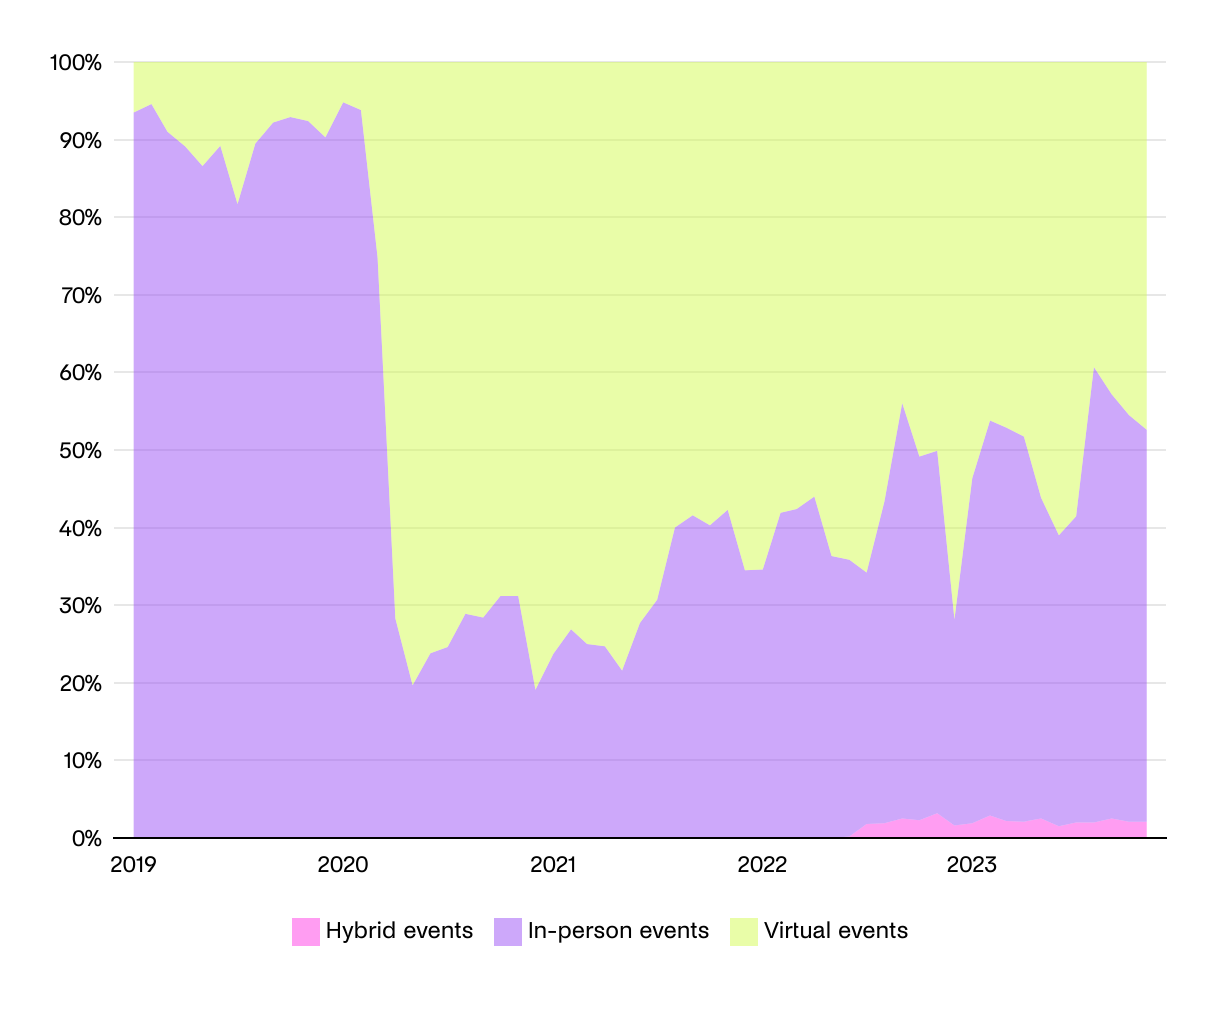
In-person events are on the rise, though virtual events still remain a popular format
Area chart from 2019 to 2023 depicting the share of hybrid events versus in-person events versus virtual events
(Please use a modern browser to see the interactive version of this visualization)