Characteristics of public appointees, 2012/13–2022/23
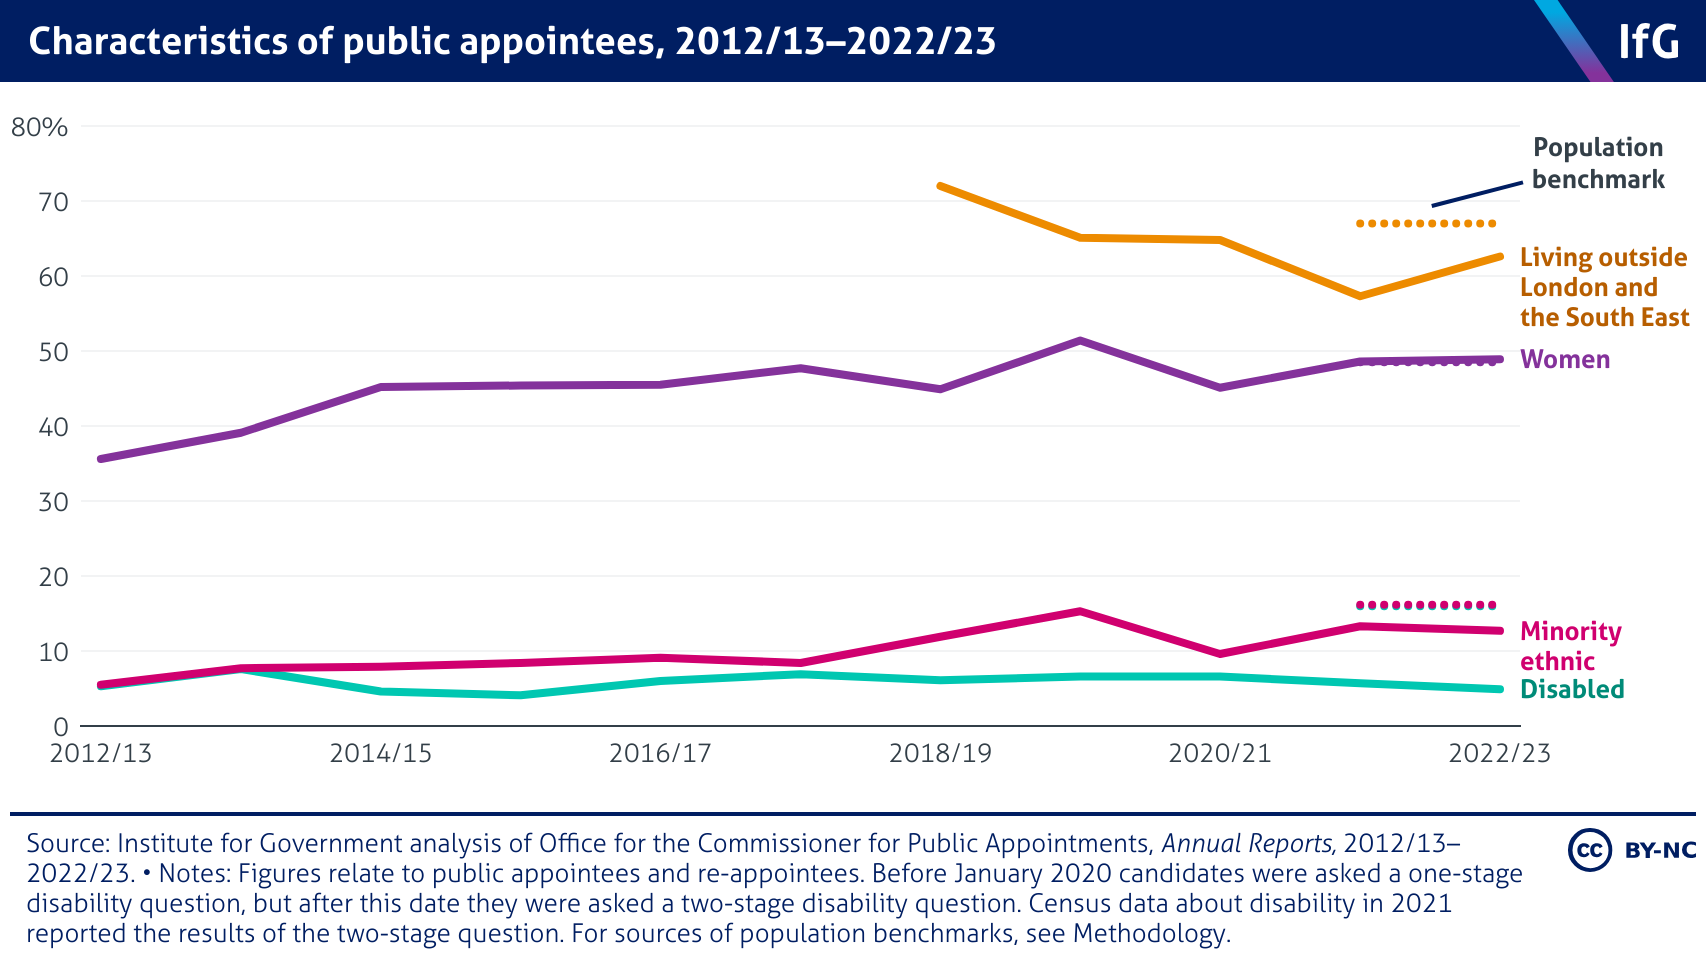
A line chart from the Institute for Government of characteristics of public appointees between 2012/13 and 2022/23, where the percentages of women and minority ethnic appointees have increased but the percentages of disabled appointees and those living outside London and the South East have decreased over time.

