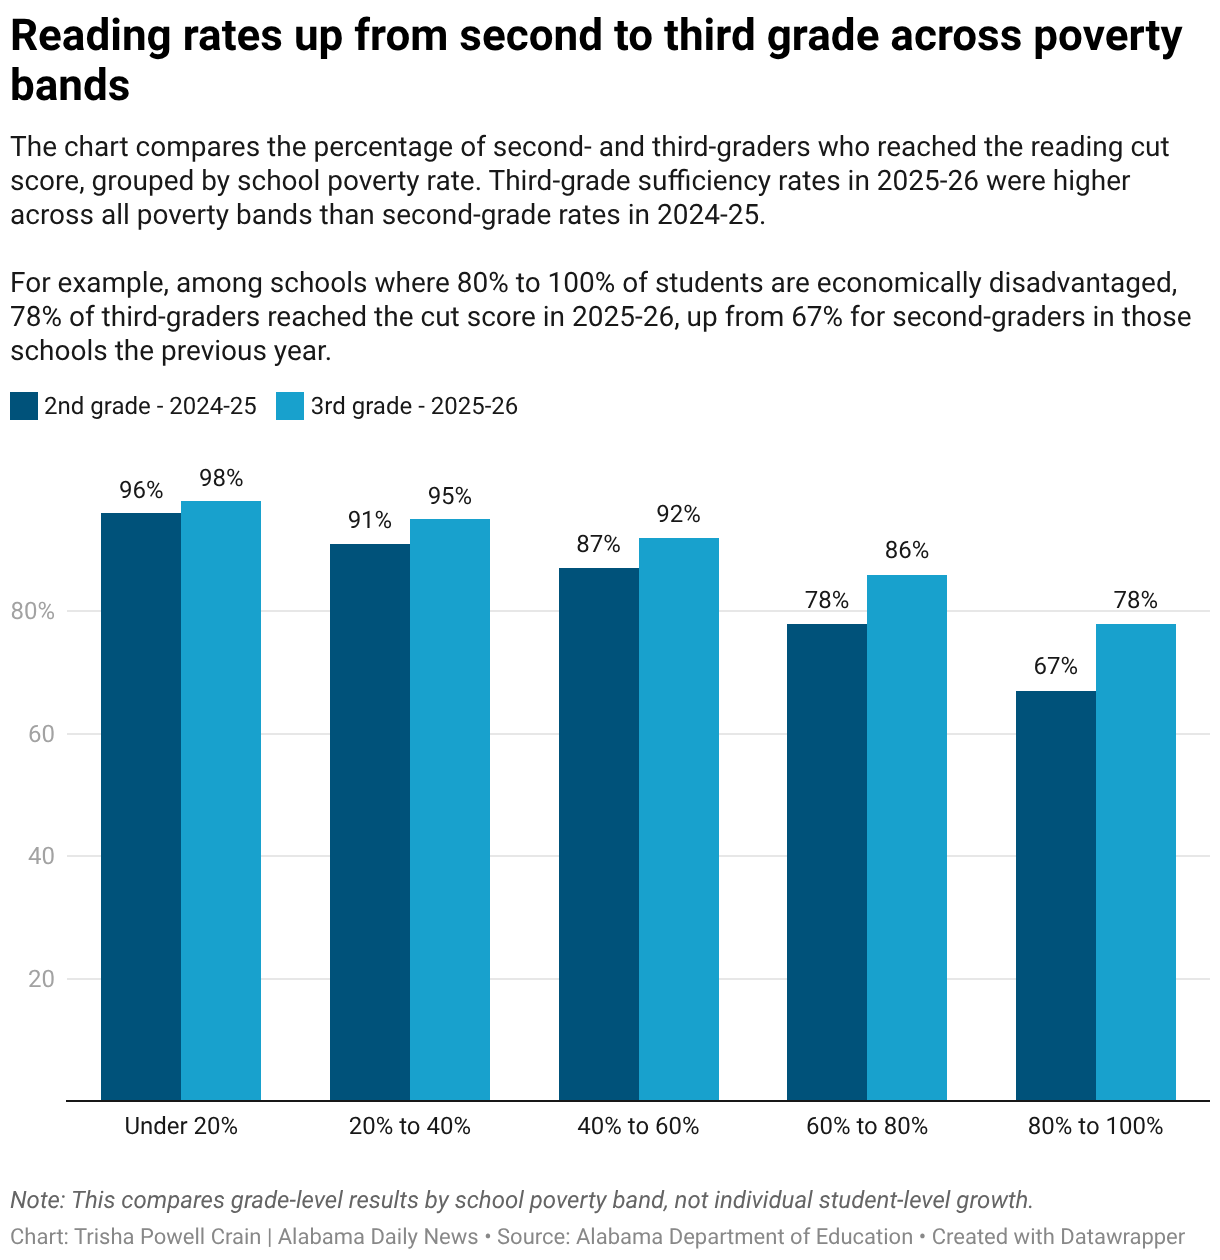
Reading rates up from second to third grade across poverty bands
The chart compares the percentage of second- and third-graders who reached the reading cut score, grouped by school poverty rate. Third-grade sufficiency rates in 2025-26 were higher across all poverty bands than second-grade rates in 2024-25.
For example, among schools where 80% to 100% of students are economically disadvantaged, 78% of third-graders reached the cut score in 2025-26, up from 67% for second-graders in those schools the previous year.
