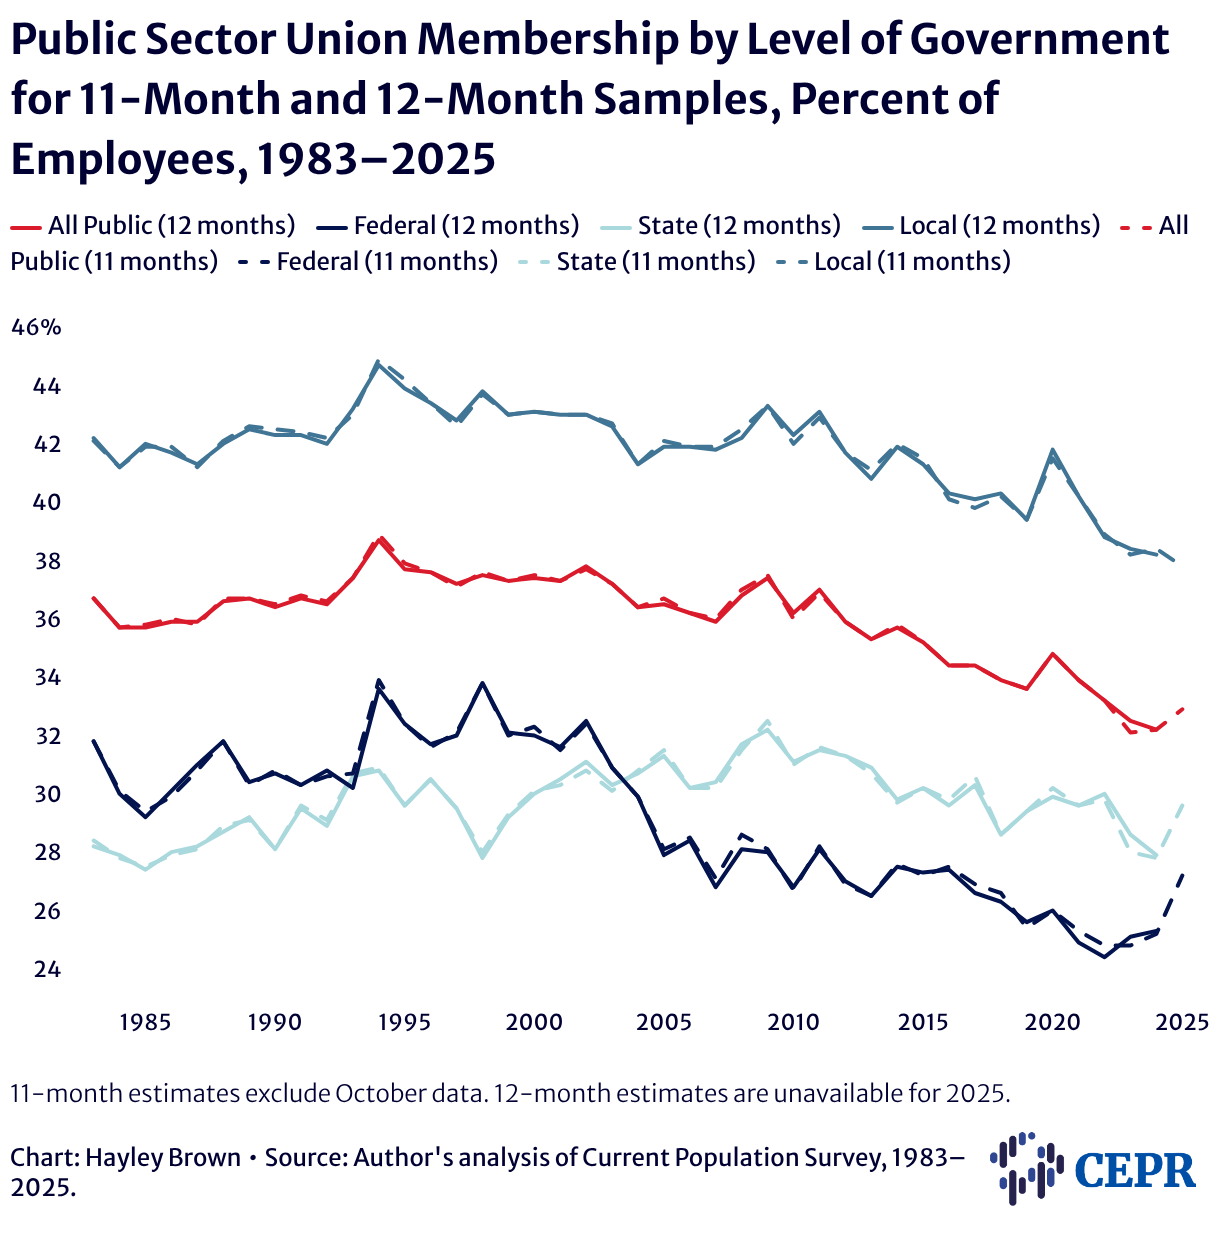
Public Sector Union Membership by Level of Government for 11-Month and 12-Month Samples, Percent of Employees, 1983–2025
Line chart showing public-sector union membership rates from 1983 to 2025. Solid lines show 12-month estimates and dashed lines show 11-month estimates. Local government is blue, all public is red, state is light teal, and federal is dark navy. Membership rates decline over time across all levels, with 11- and 12-month estimates closely aligned.

11-month estimates exclude October data. 12-month estimates are unavailable for 2025.