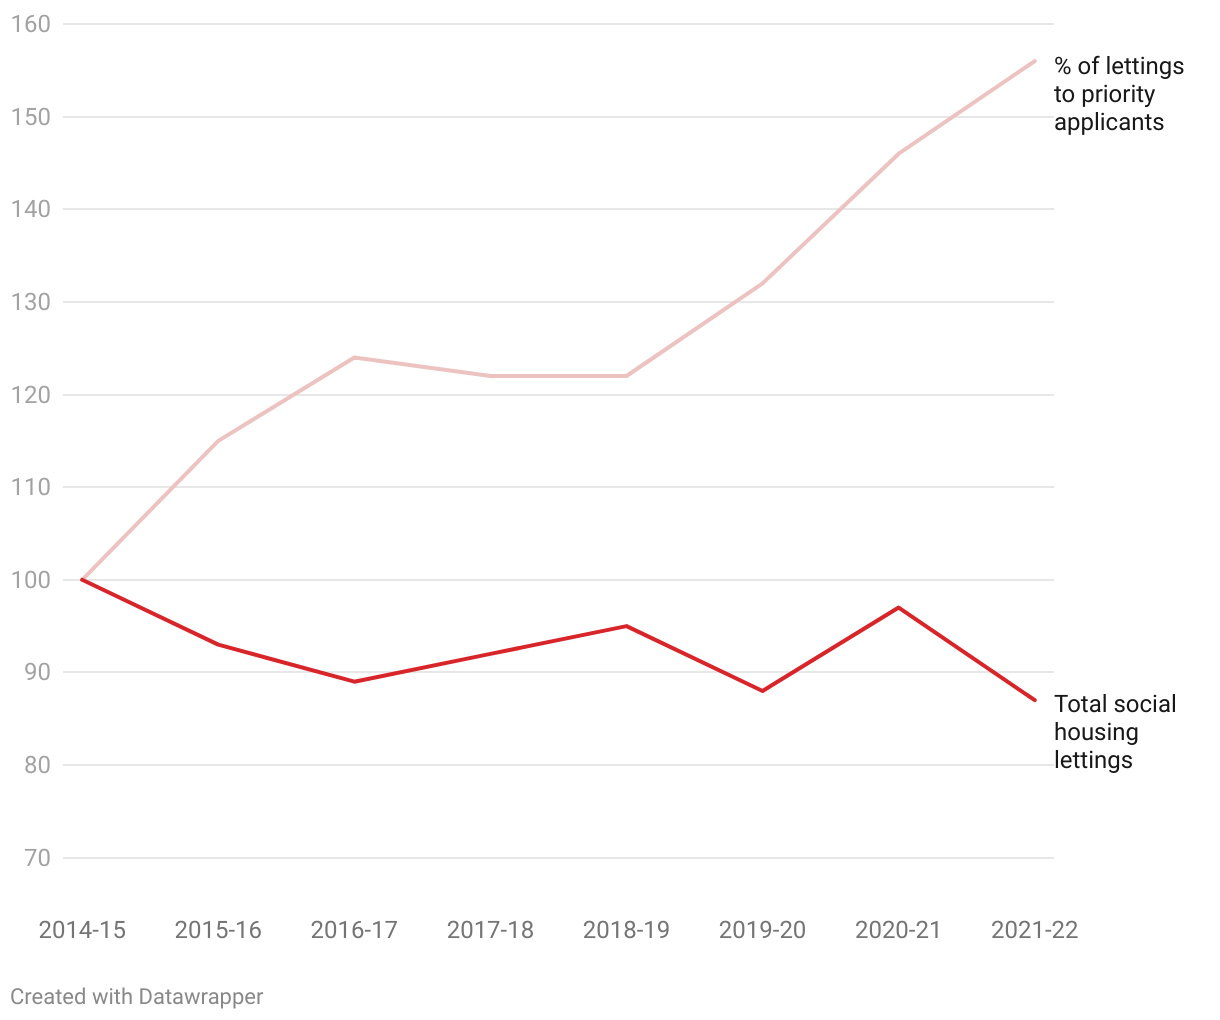
NSW social housing supply and letting to priority applicants
Values are indexed (2014-15 = 100) to show relative changes in total number of lettings and in proportion of lettings going to priority applicants.
Line graph showing changes in total number of social housing lettings against percentage going to priority applicants from 2014-15 to 2021-22