House: Energy bills, gas and petrol vs electric
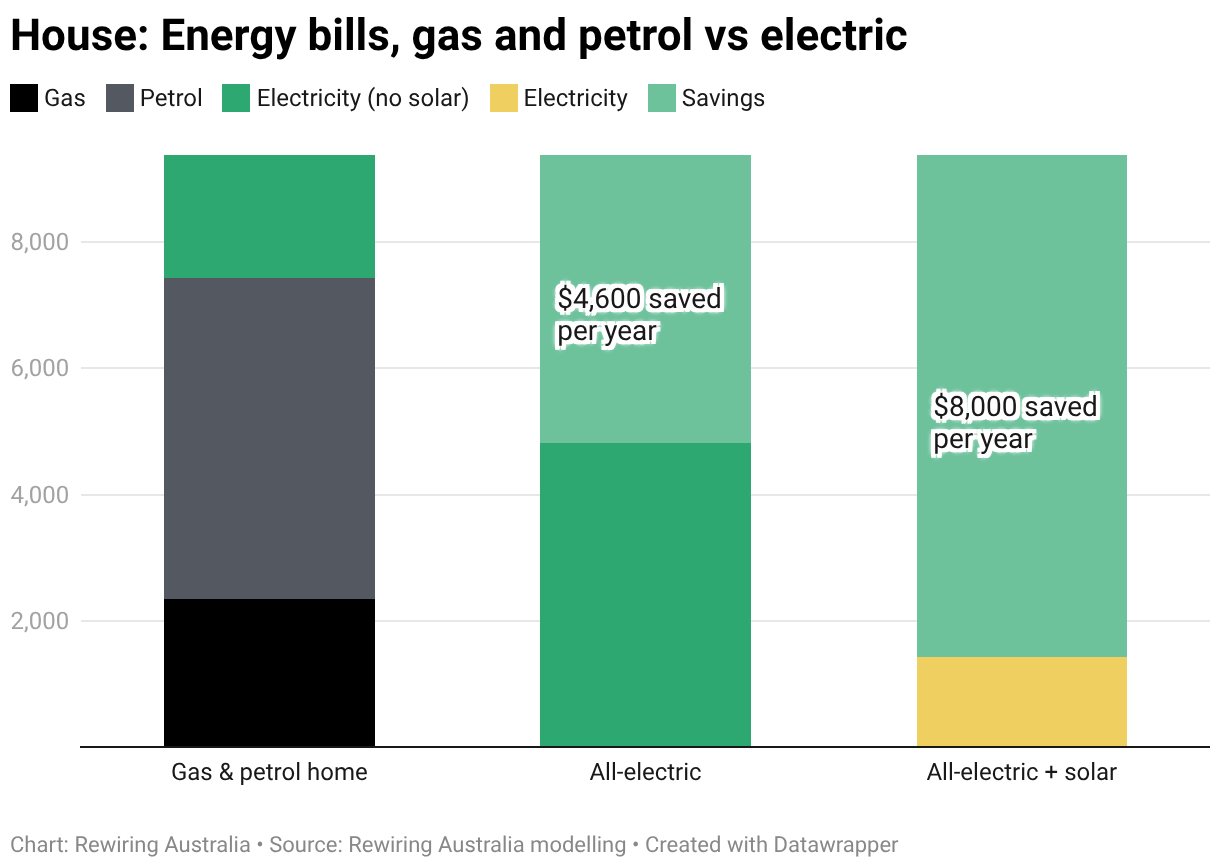
This bar chart shows the annualised 15-year bills from running gas appliances and petrol cars versus the same average home using efficient electric alternatives, solar and a battery.
(Please use a modern browser to see the interactive version of this visualization)