Assessment growth
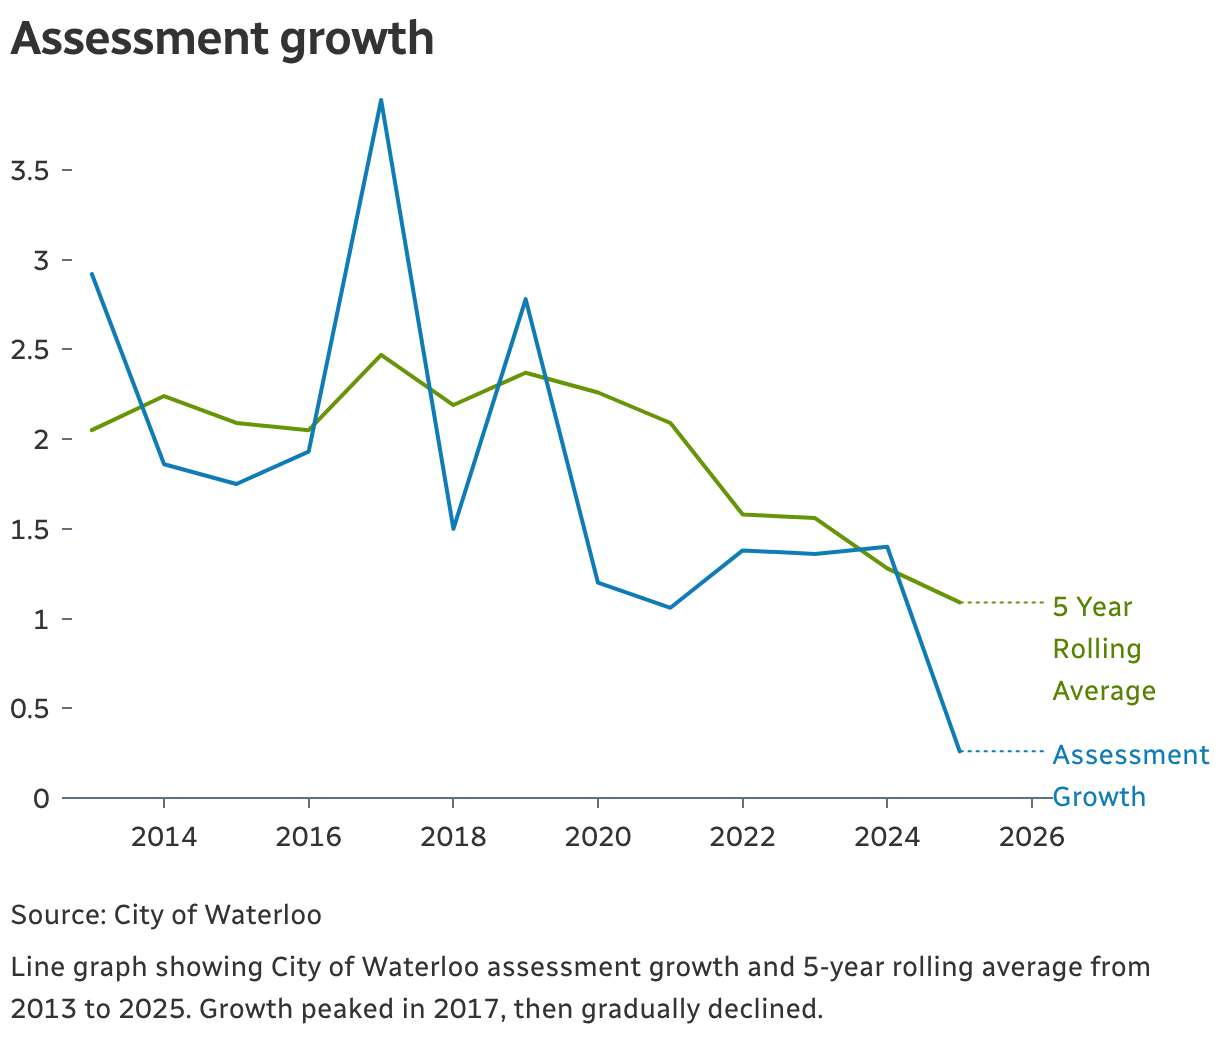
Line graph showing assessment growth and 5-year rolling average from 2013 to 2025. Growth peaked in 2017, then gradually declined.
(Please use a modern browser to see the interactive version of this visualization)