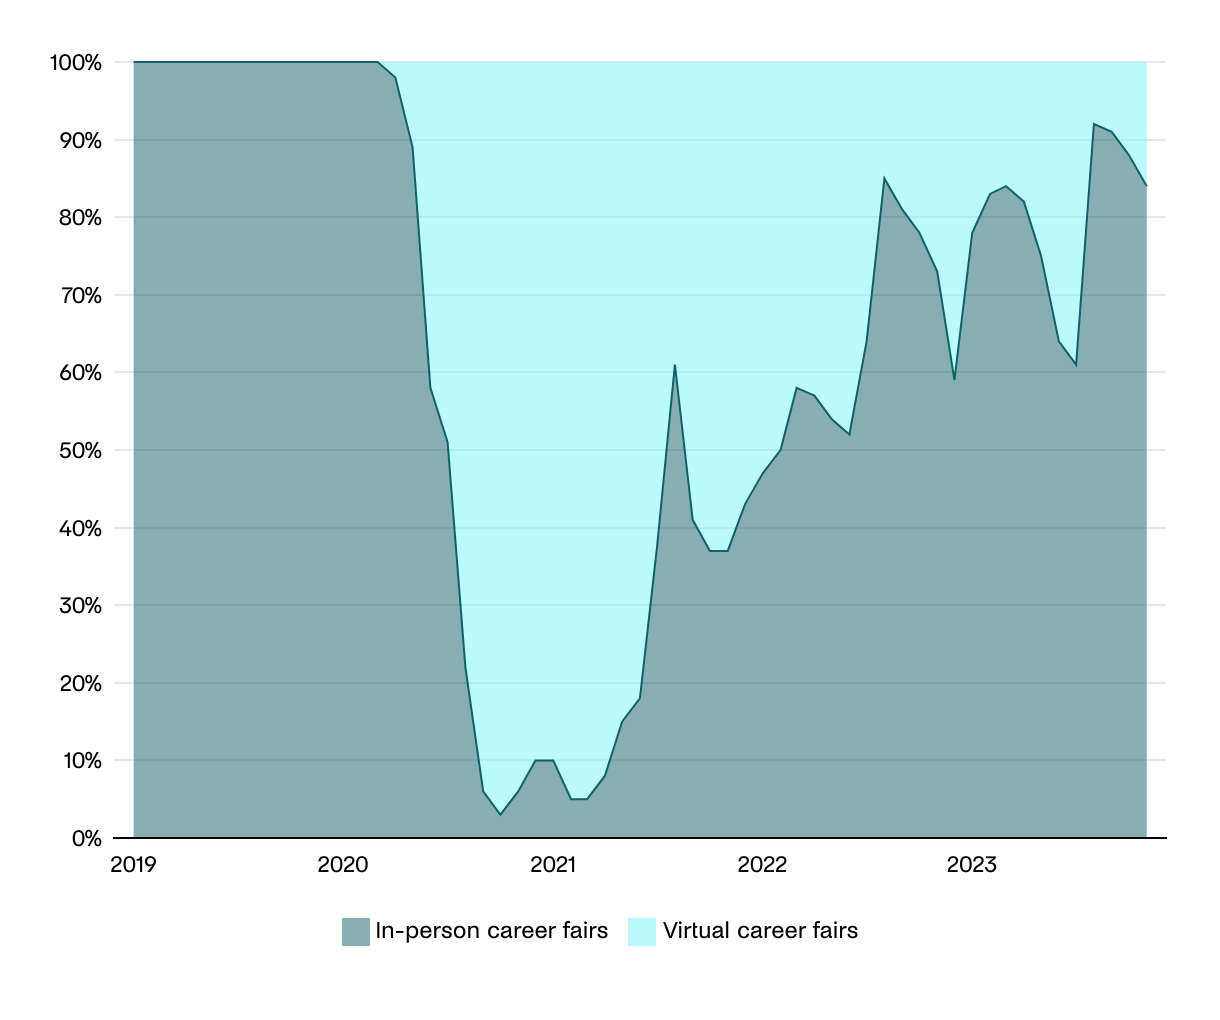
In-person career fairs have made a comeback after an all-time low in 2021
Are chart from 2019 to 2013 depicting the breakdown of in-person fairs versus virtual fairs
(Please use a modern browser to see the interactive version of this visualization)