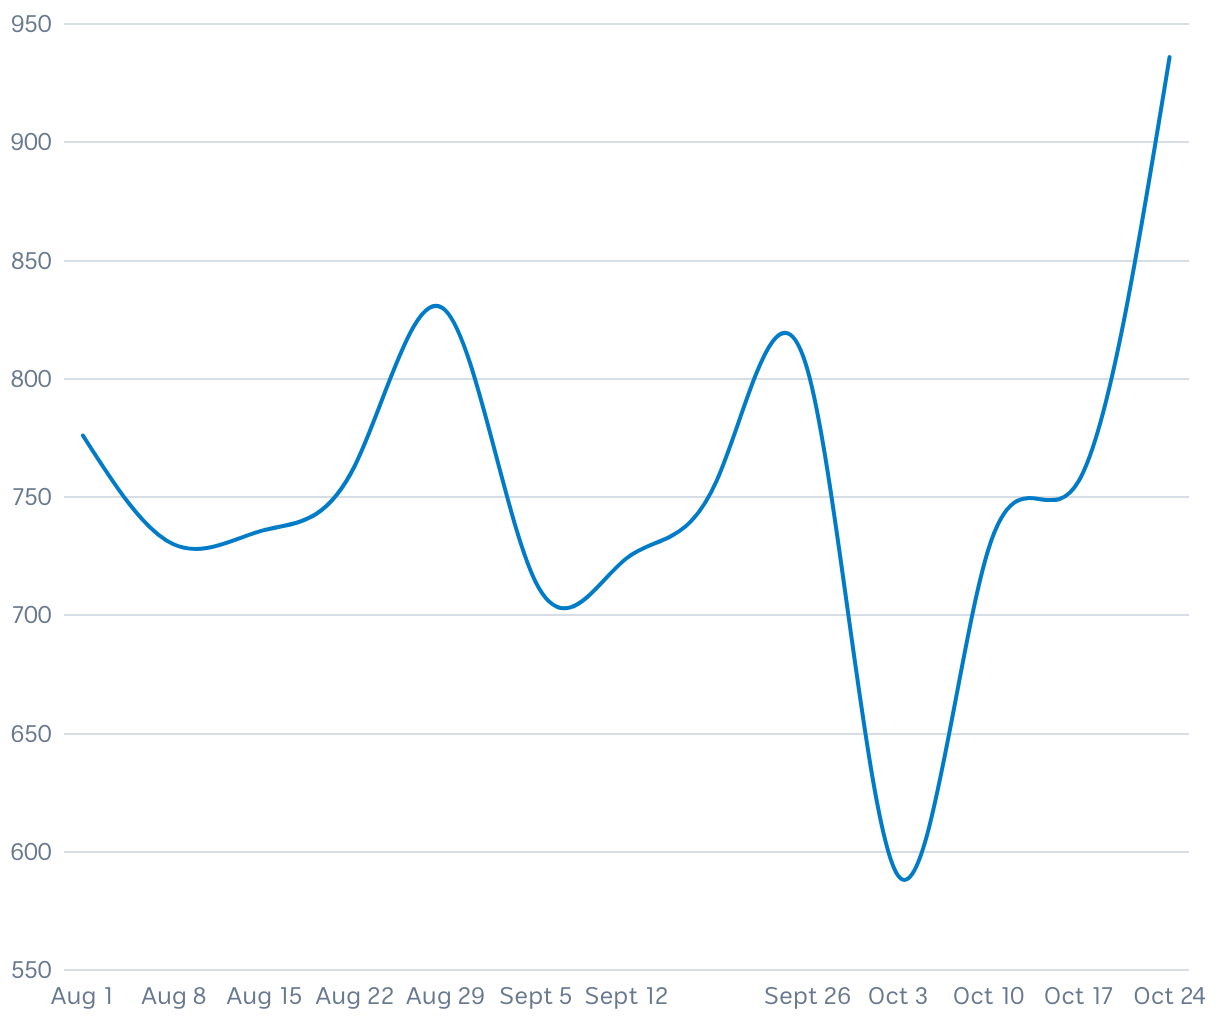
National COVID-19 cases on a 7-day rolling average
Case numbers between August and October 2023
A line graph showing the COVID case numbers between August to October using a 7-day rolling average where a spike is seen in October.
Case numbers between August and October 2023