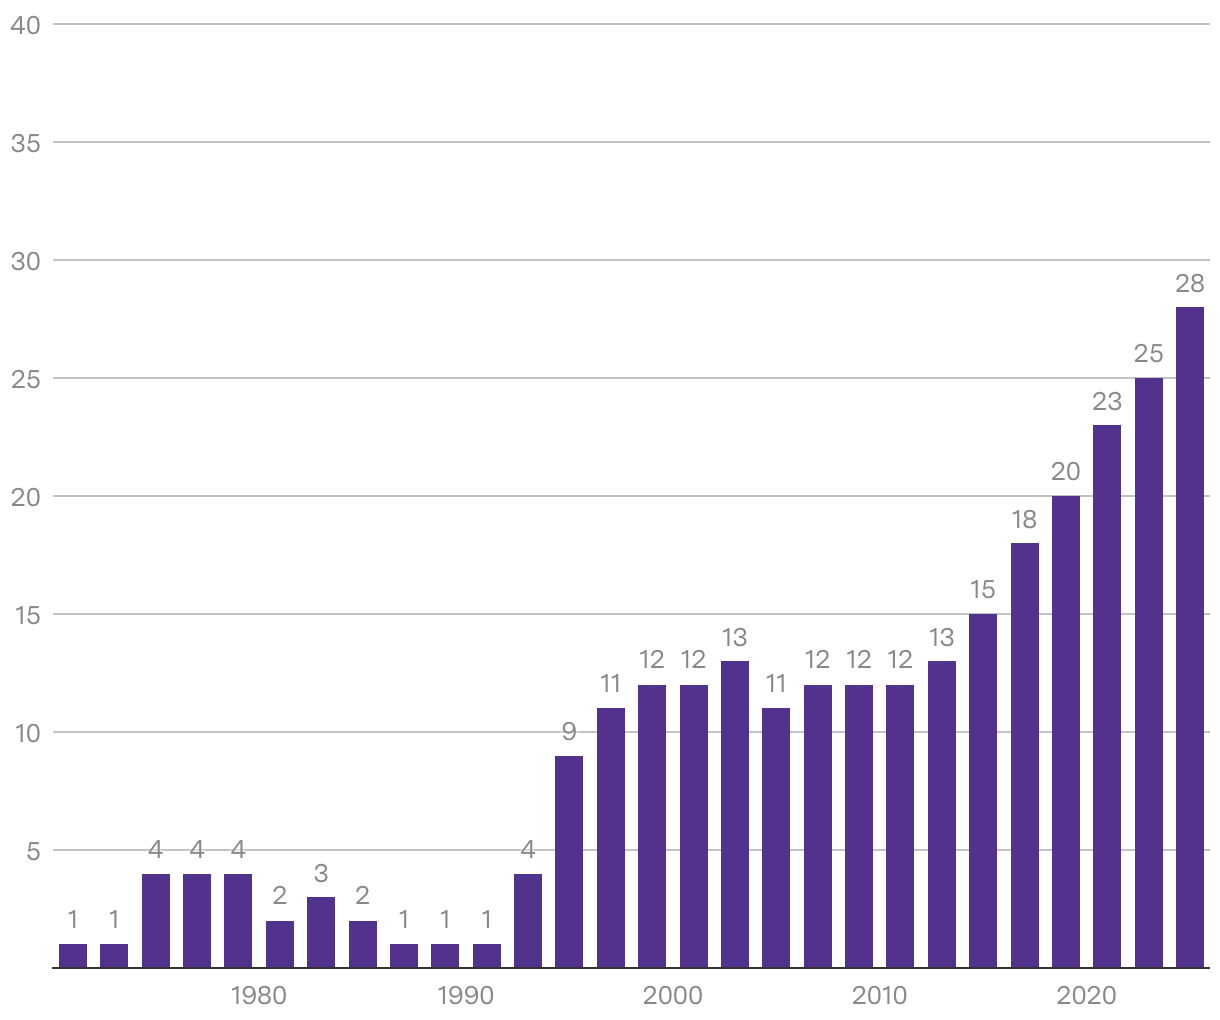
Black women's congressional representation has slowly grown over the past 50 years
Number of Black women in each Congress by last year of session
Column chart showing a slow increase in the number of Black women in Congress beginning in the session ending in 1971 (1 officeholder) through 2023 (28 officeholders). The upward trend started in the mid-1990s and began increasing more in the late 2010s.