Real-terms change in local authority spending power since 2010/11, by local authority

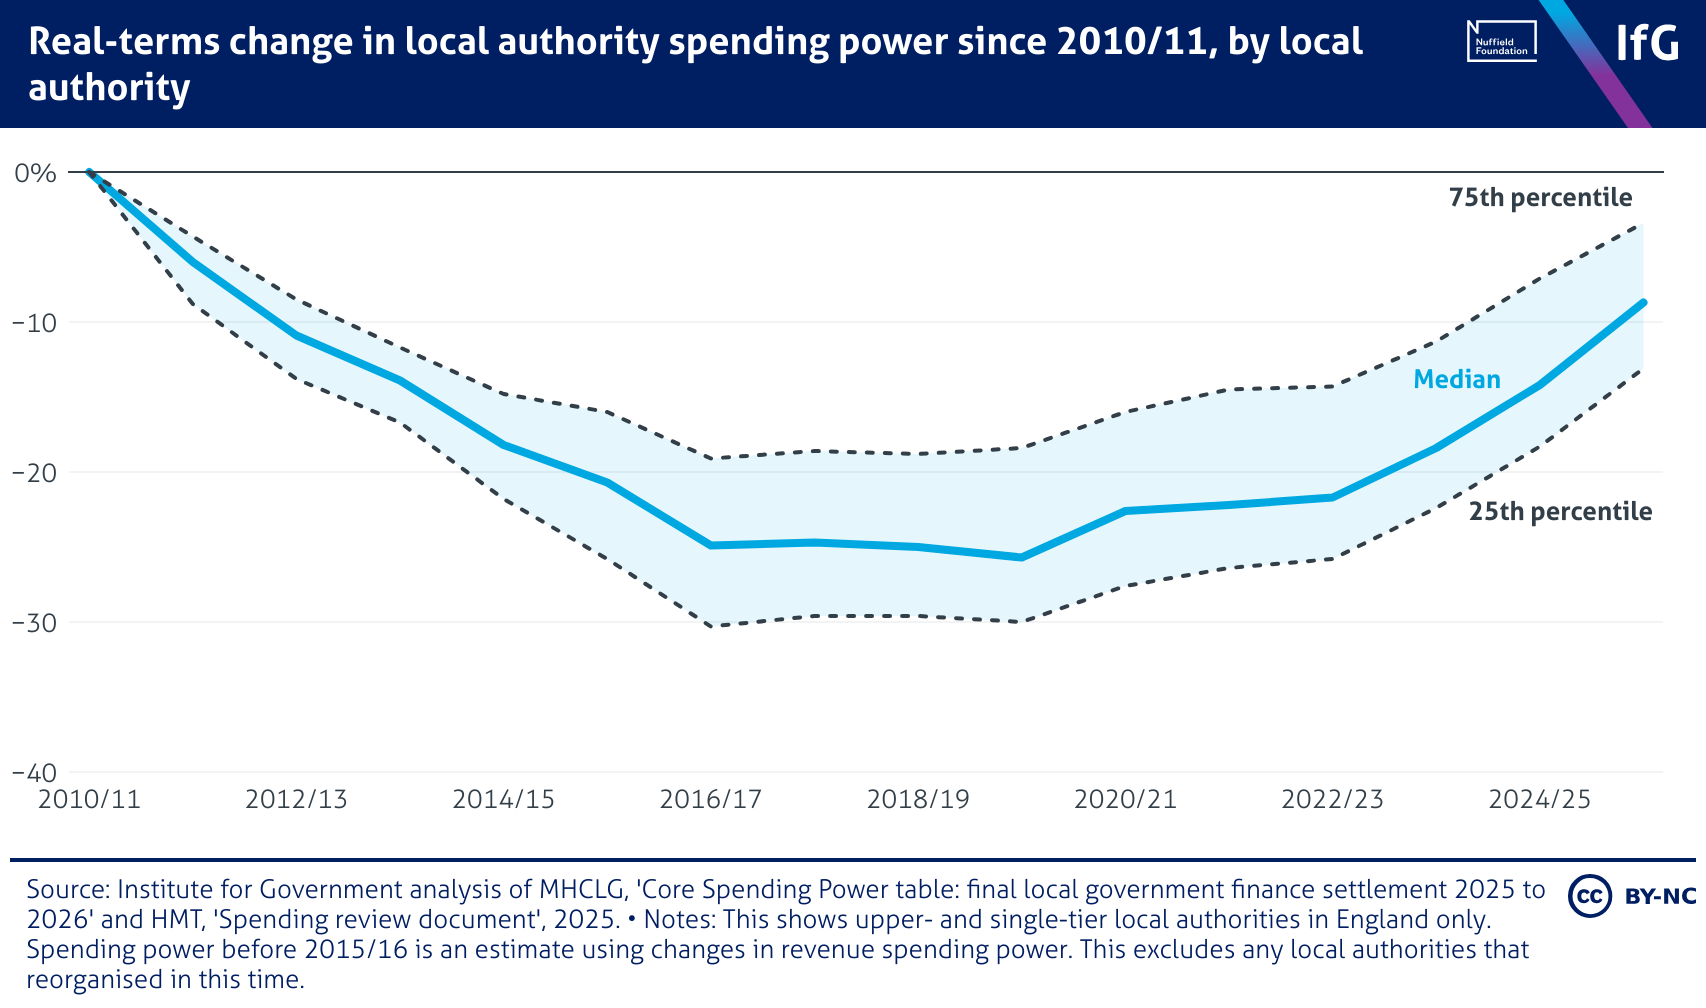
A line chart from the Institute for Government of real-terms change in local authority spending power since 2010/11, by local authority, where the median fell by just over 25% up to 2019/20 before partly recovering, with the gap between the 25th and 75th percentile widening since 2010/11.

