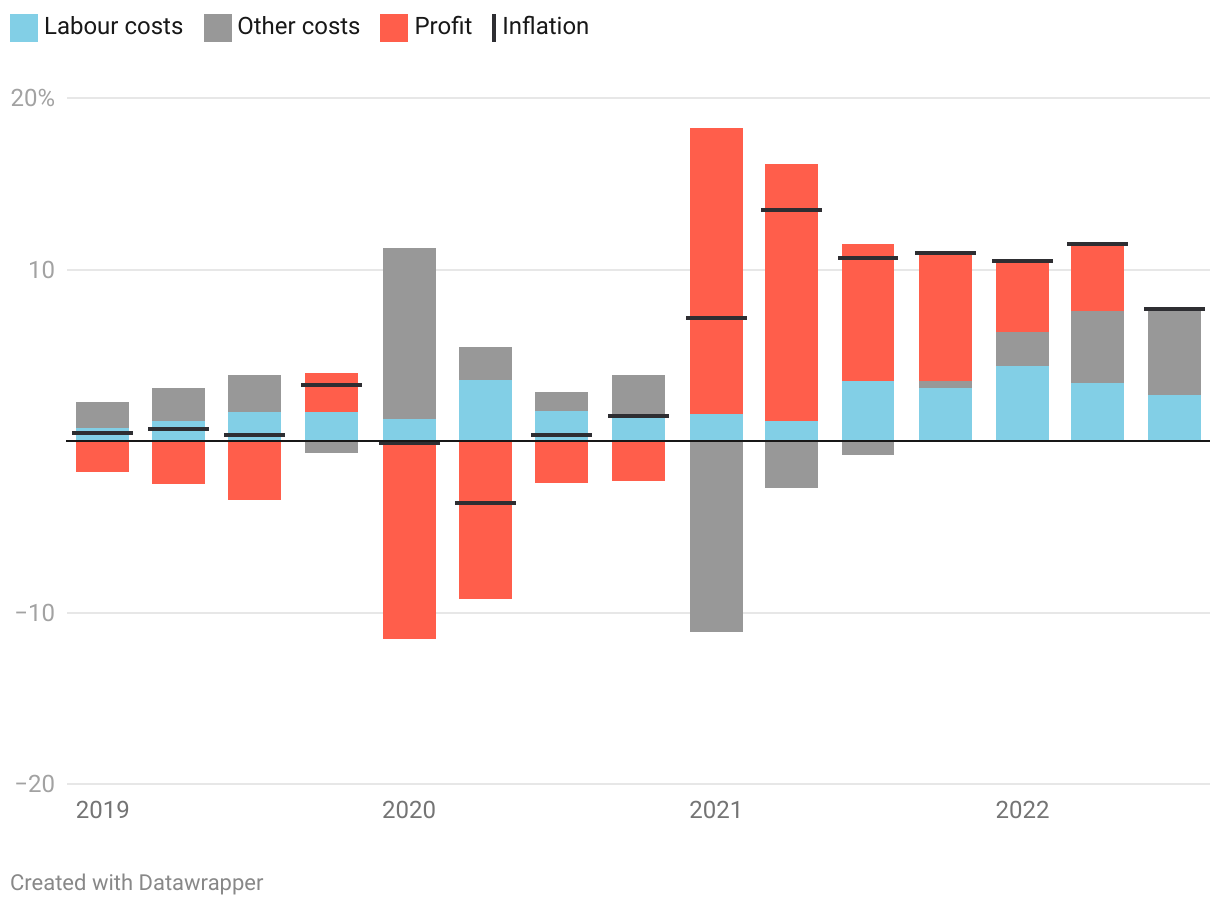
Figure 3: Inflation from the corporate sector by labour, profit and other costs
Percentage change year-over-year by quarter, black lines indicate inflation (business sector price deflator)
Figure 3: Stacked bar chart of the quarterly year-over-year drivers of inflation in the corporate sector beginning in the first quarter of 2019 broken down by profits, labour compensation, and other costs. The inflationary surge starting in 2021 was driven almost entirely by profits.