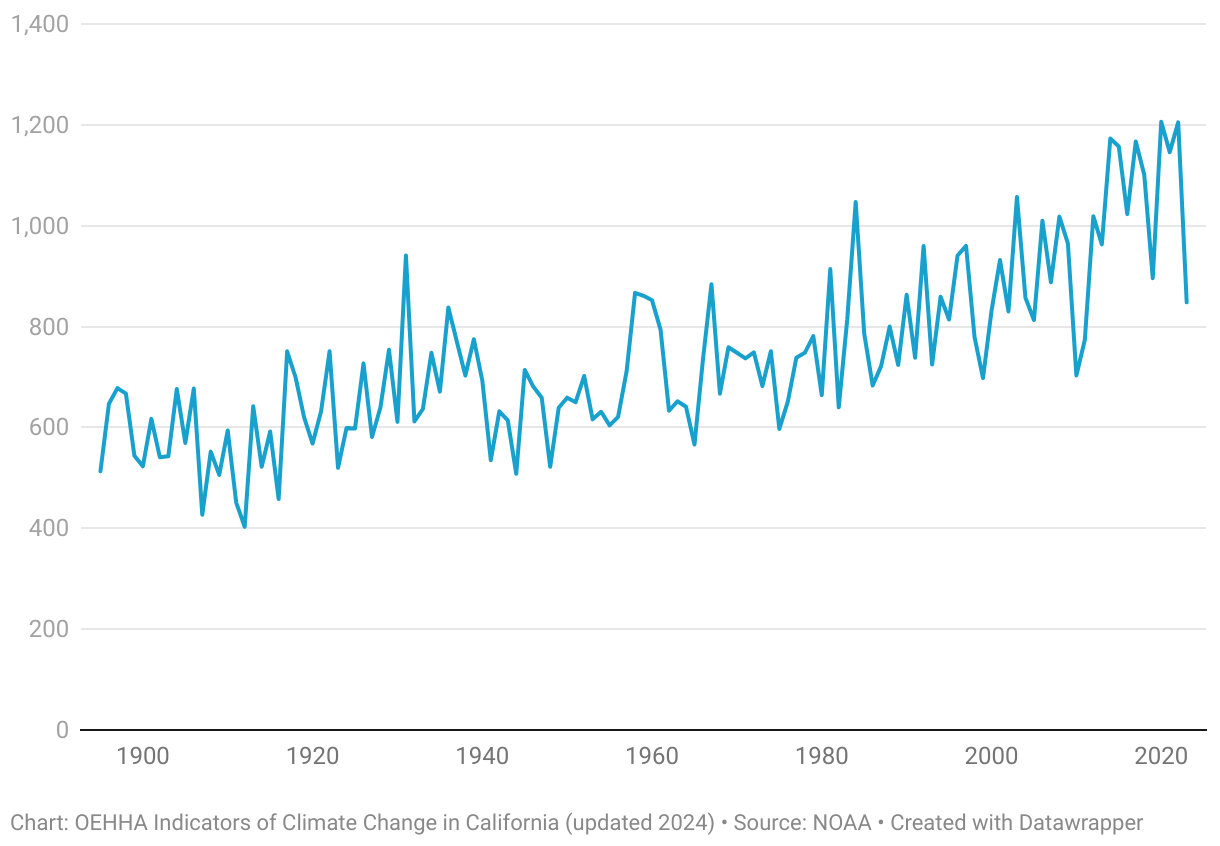
This line graph shows a rise in annual cooling degree days from 1895 to 2023.
(Please use a modern browser to see the interactive version of this visualization)
