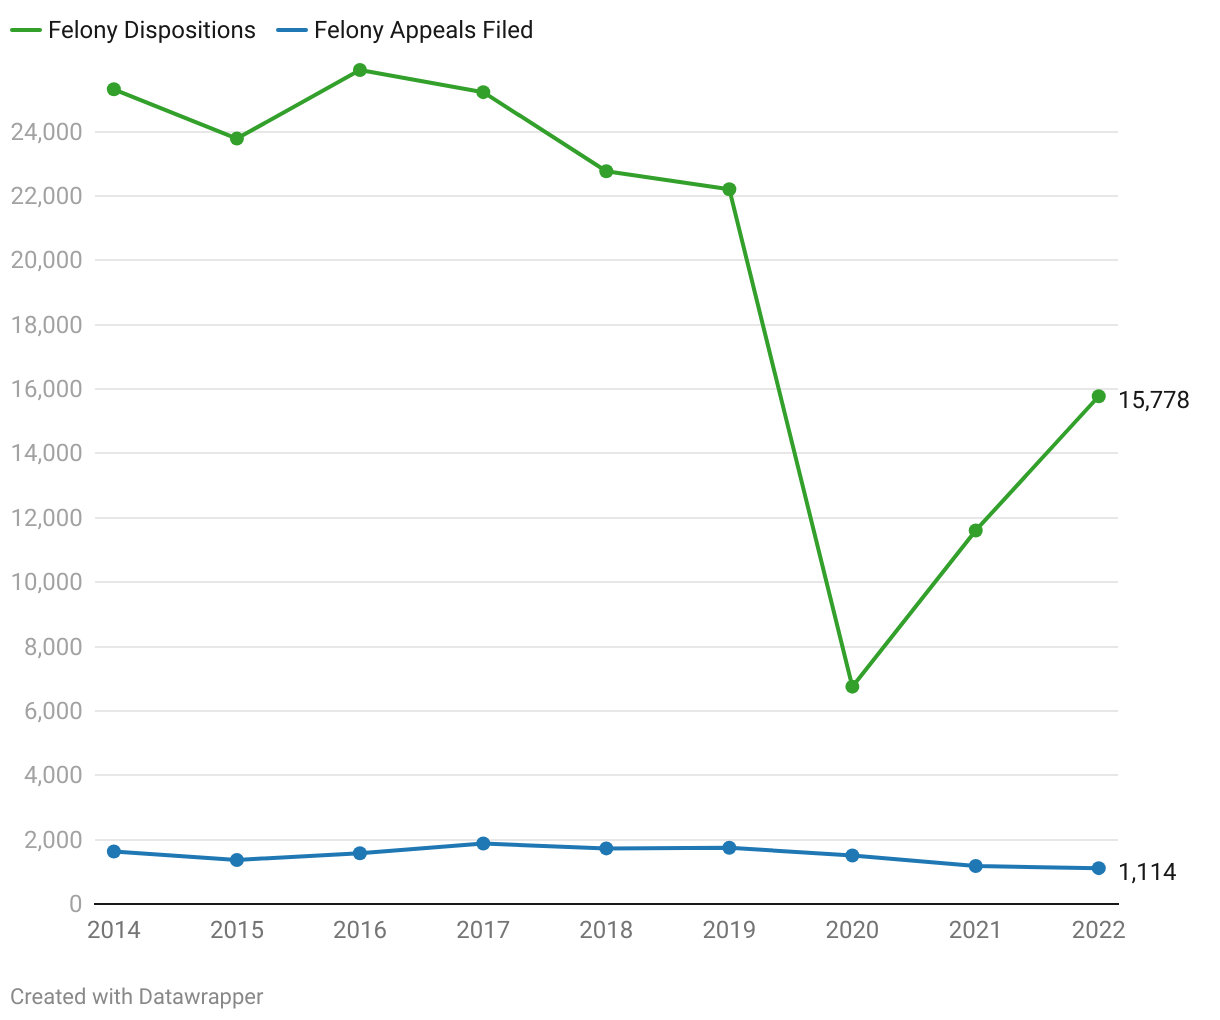
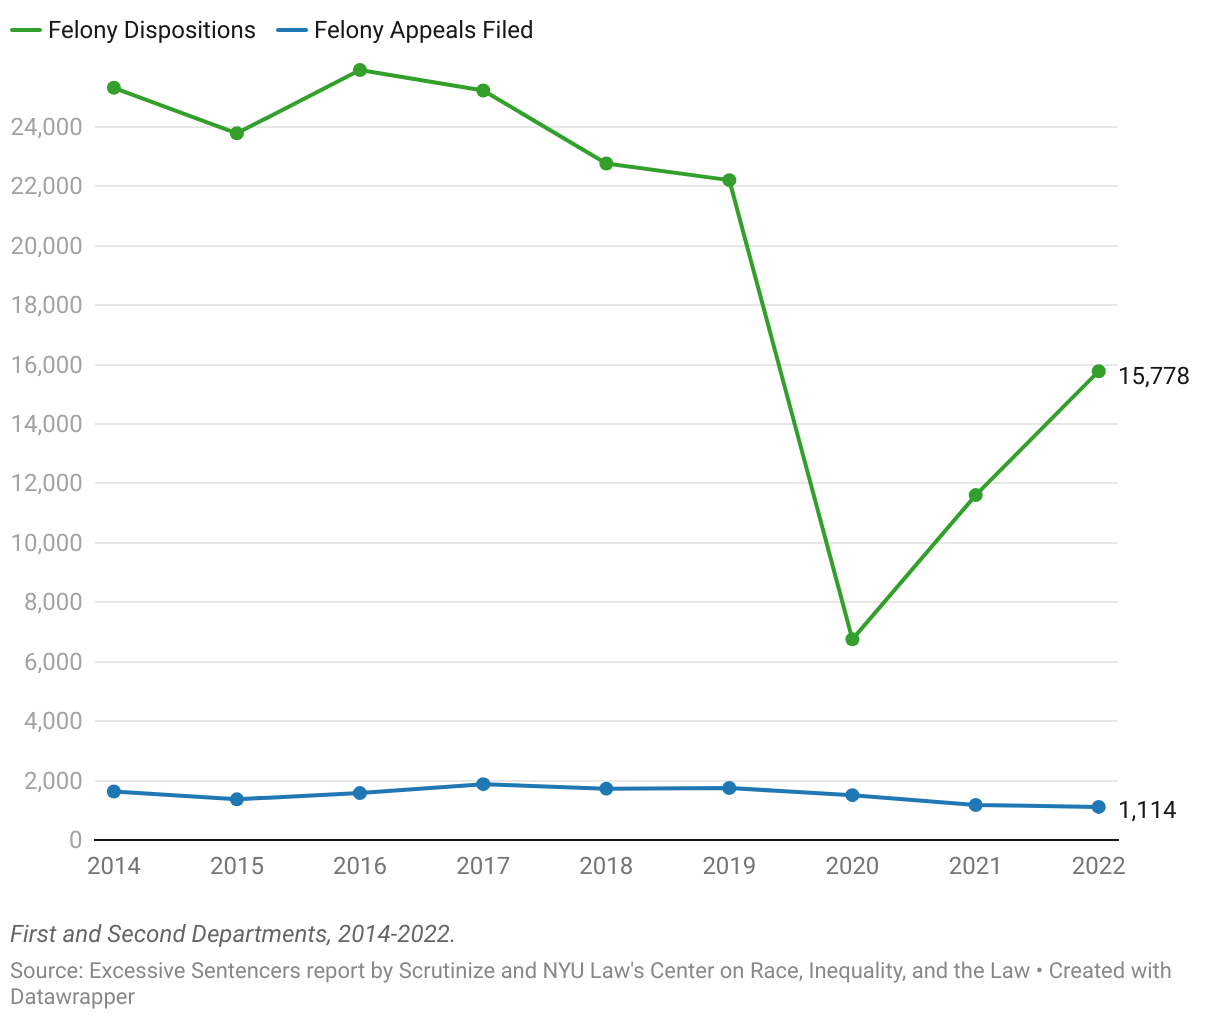
This graph displays annual data across nine years, from 2014 to 2022, focusing on felony dispositions and total appeals filed in a certain jurisdiction. For each year, the graph presents two key figures: the number of felony dispositions, which include both convictions and guilty pleas, and the number of appeals filed. The graph demonstrates visually the large gap between the number of felony dispositions in a year and the number of felony appeals filed.