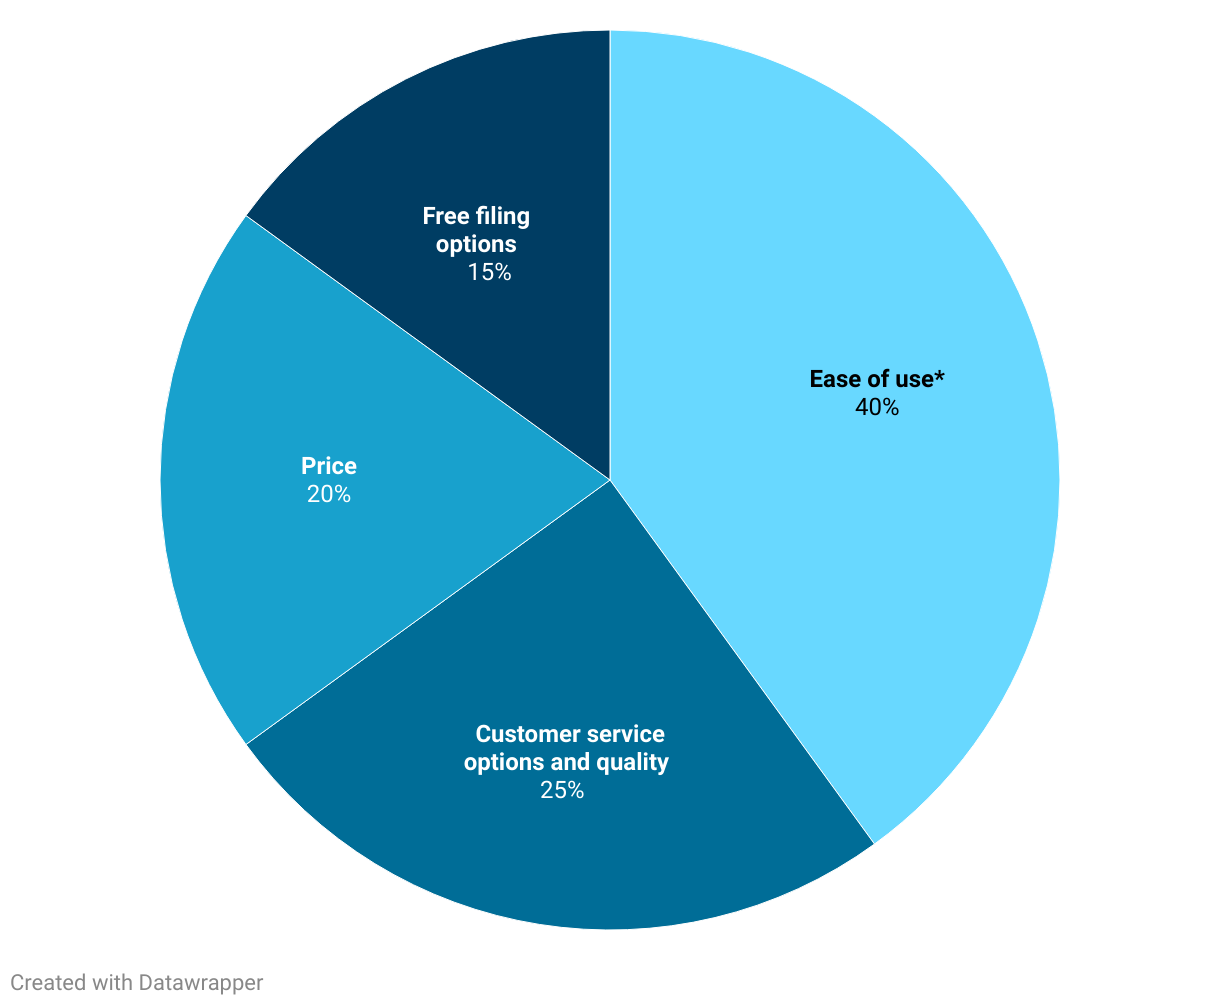
Pie chart: Ease of use 40% Customer service options and quality 25% Price of filing 20% Free filing options 15%
(Please use a modern browser to see the interactive version of this visualization)