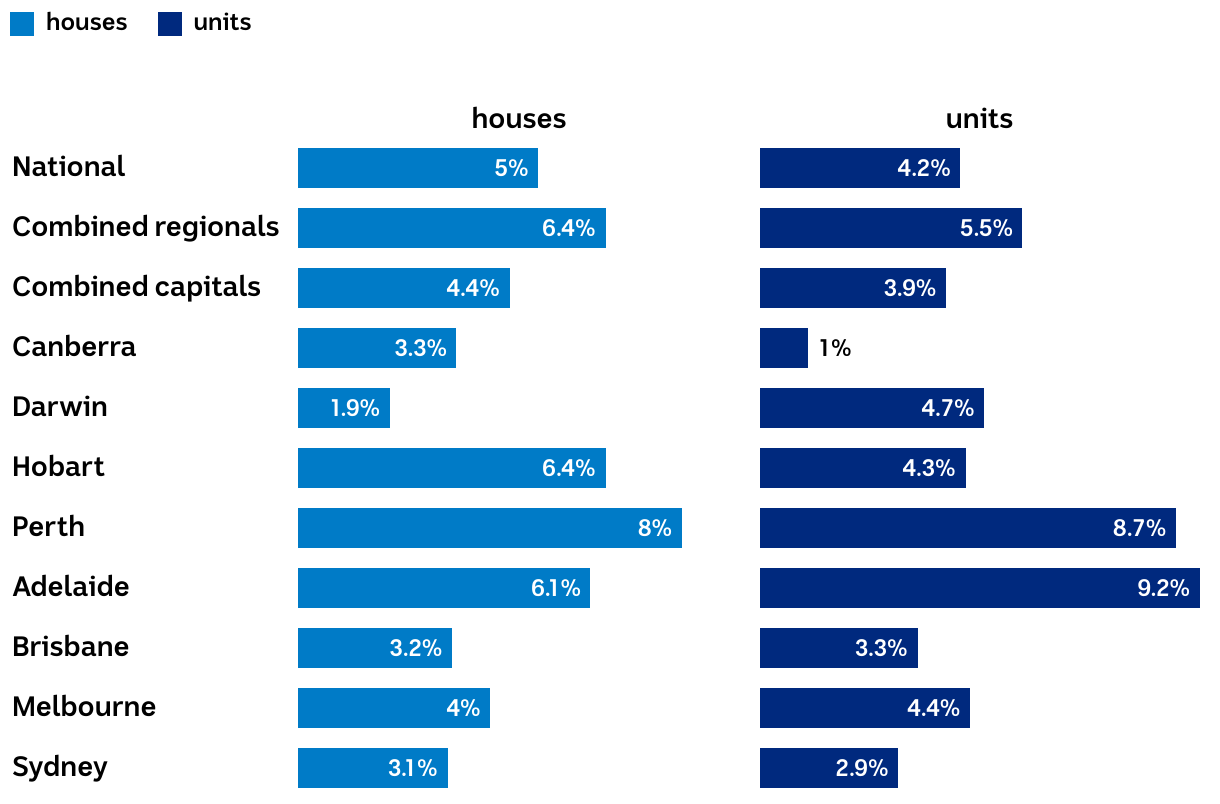
12 month change in rental rates
Bar graph showing the gross rental yields by percentage, for a 12 month change in rental rates
(Please use a modern browser to see the interactive version of this visualization)