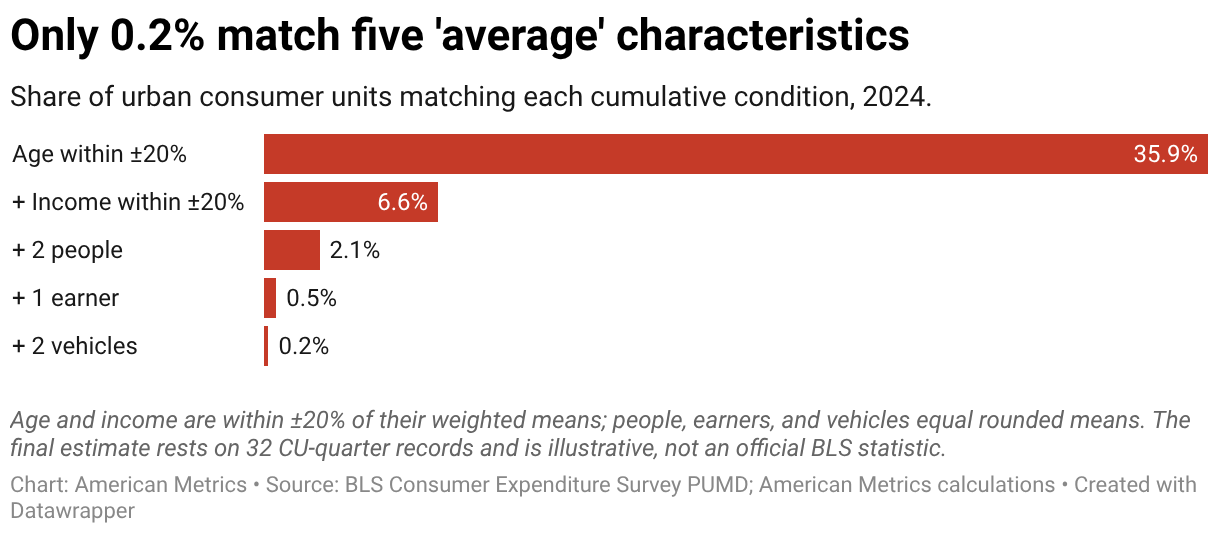
Only 0.2% match five 'average' characteristics
Share of urban consumer units matching each cumulative condition, 2024.
A horizontal bar chart shows the share of urban consumer units falling from 35.9% when matching average age to 0.2% after successively adding income, household size, earners, and vehicles. Age and income may differ by 20%; the final estimate is based on 32 survey records and is illustrative.