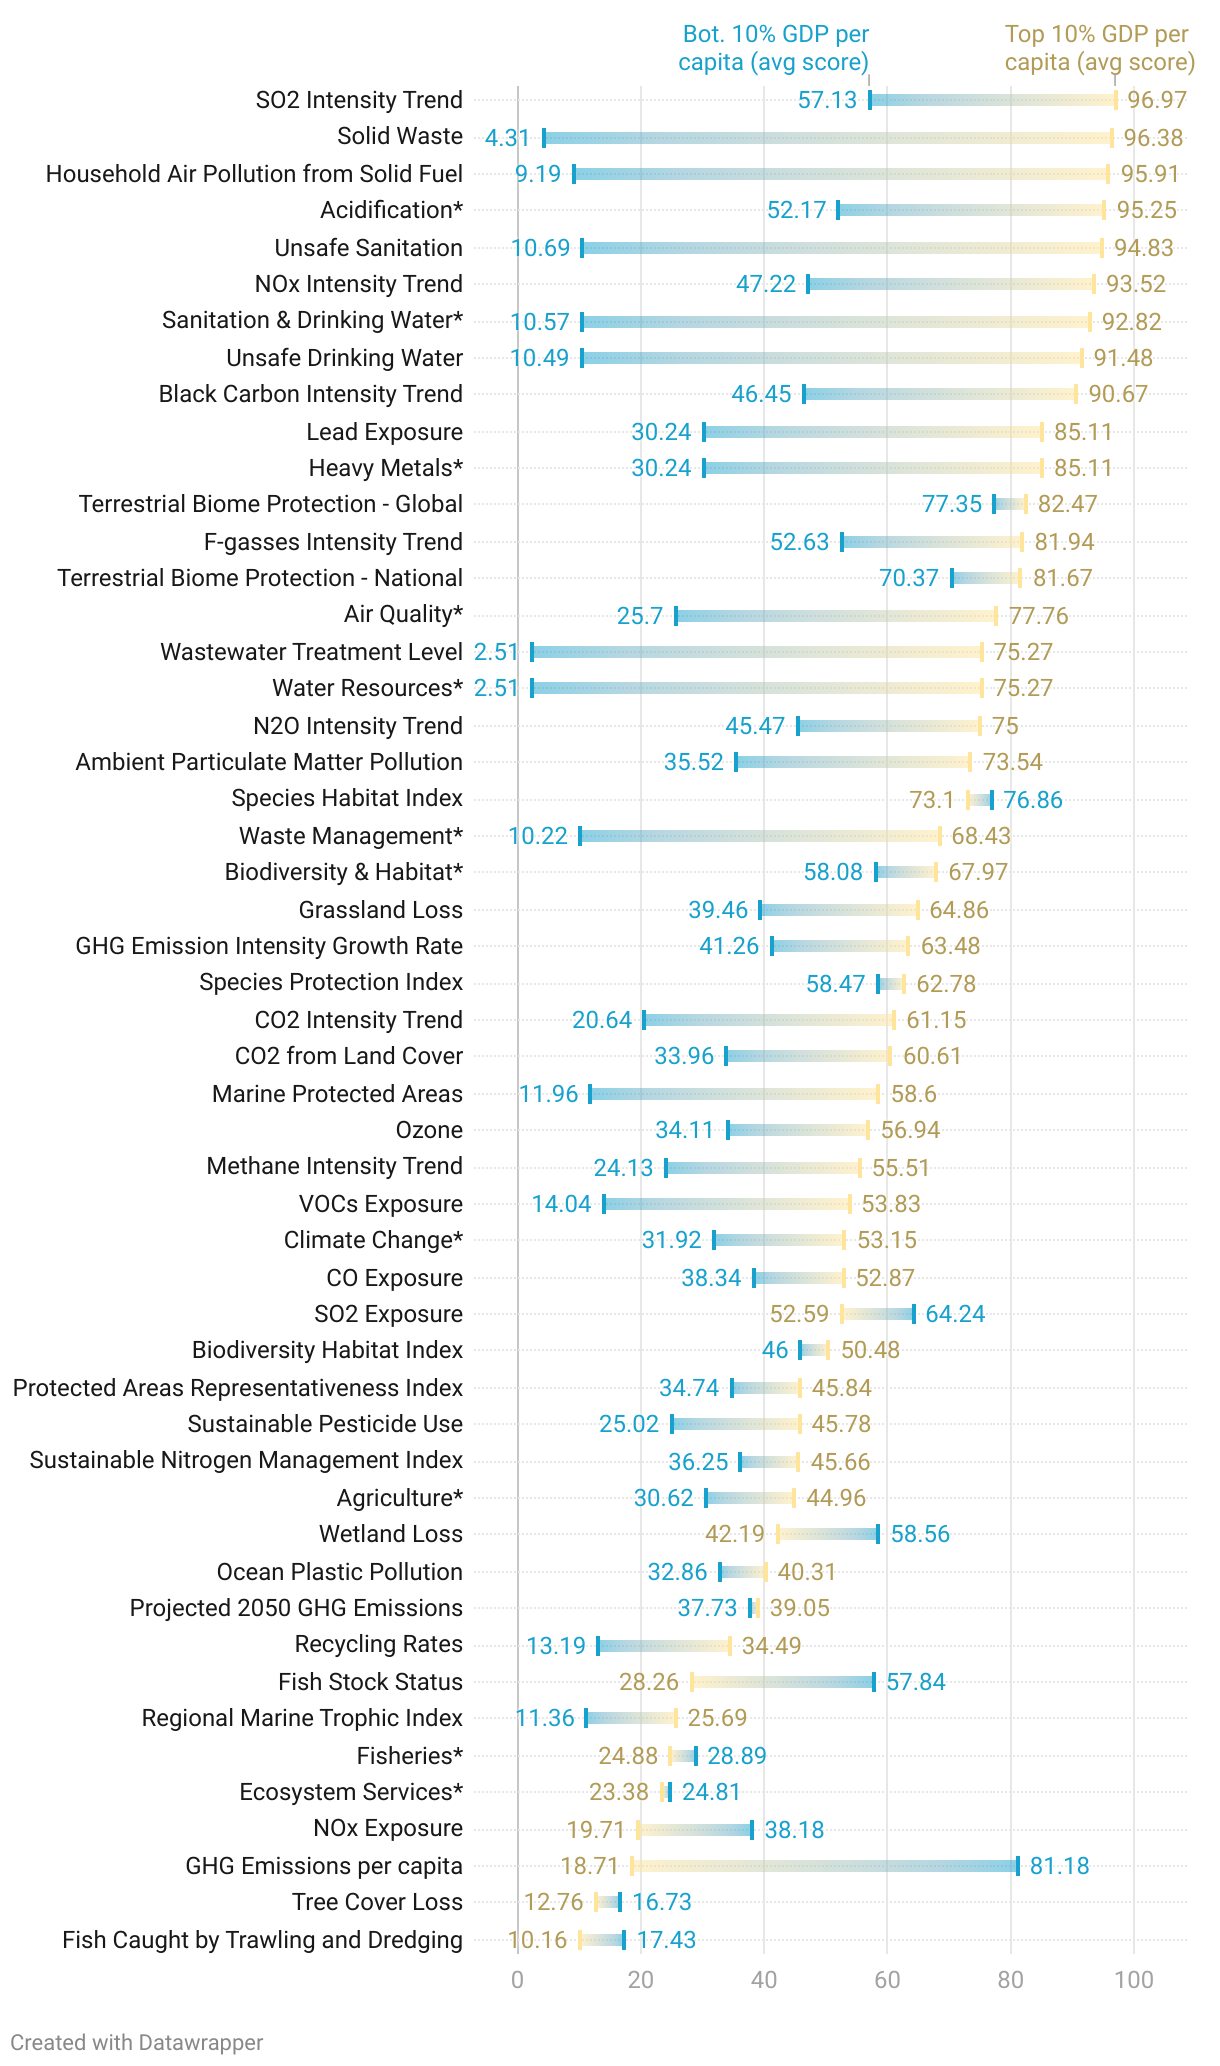
Indicator score differences between richest and poorest countries
Which EPI indicators are most correlated with GDP per capita? The range plot shows the average indicator score of the top (yellow) and bottom (blue) 10% of countries in terms of GDP per capita. Score differences are largest among the environmental health indicators, where richer countries have an advantage. Differences are smaller for climate change indicators, and poorer countries score better in several ecosystem vitality indicators. (* Issue Categories)