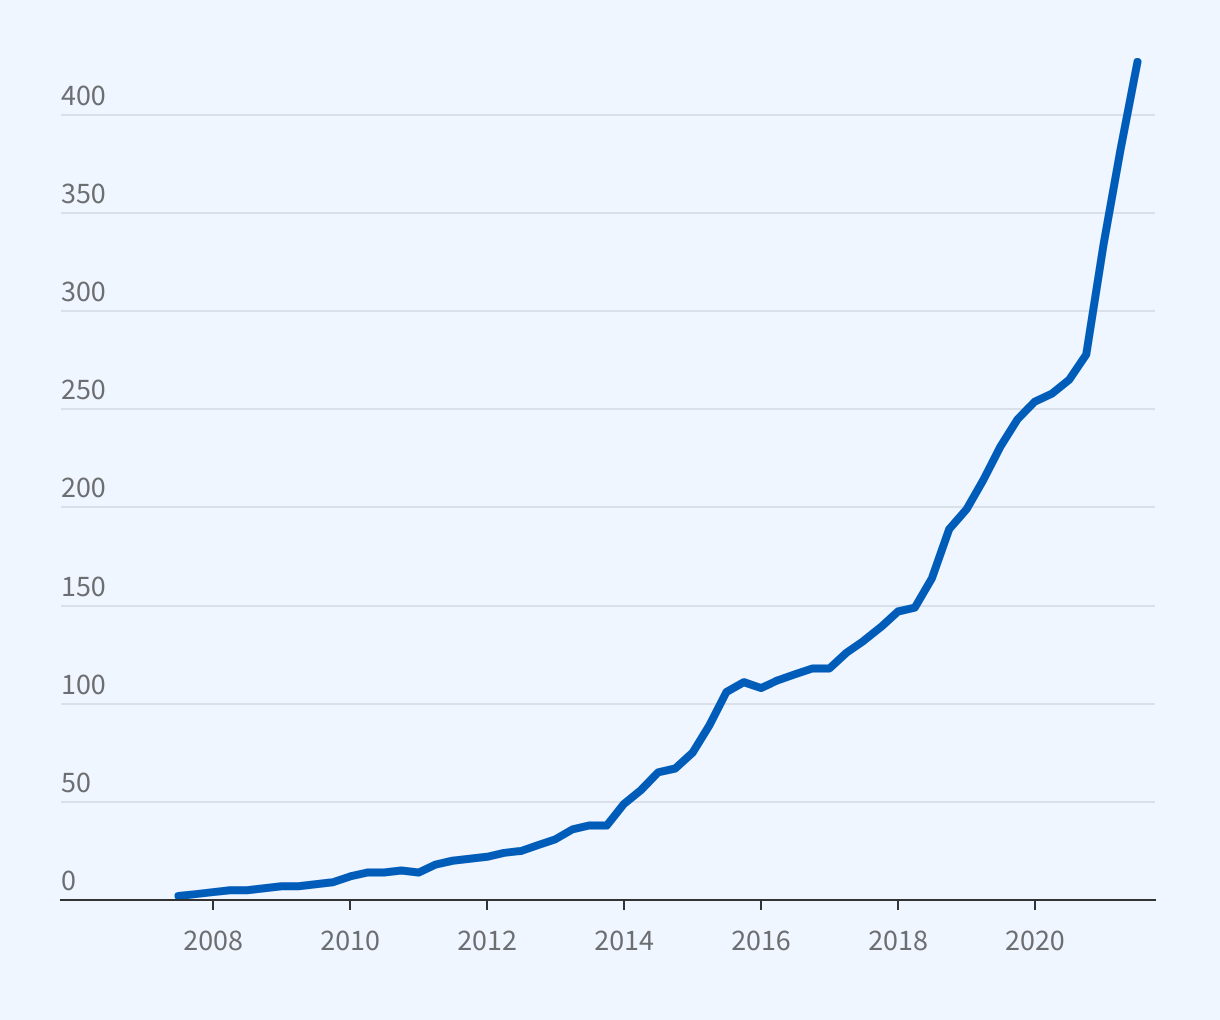
Number of Active "Unicorns"
The graph is a line chart titled, “Number of Active ‘Unicorns’.”
The y-axis ranges from 0 to 400, and the x-axis spans 2007 Q3 to 2021 Q3.
In 2007 Q3, the number of active unicorns was 2; by 2021 Q3, the number was 427.
Source: Researcher's calculations using data from CB Insights and other sources