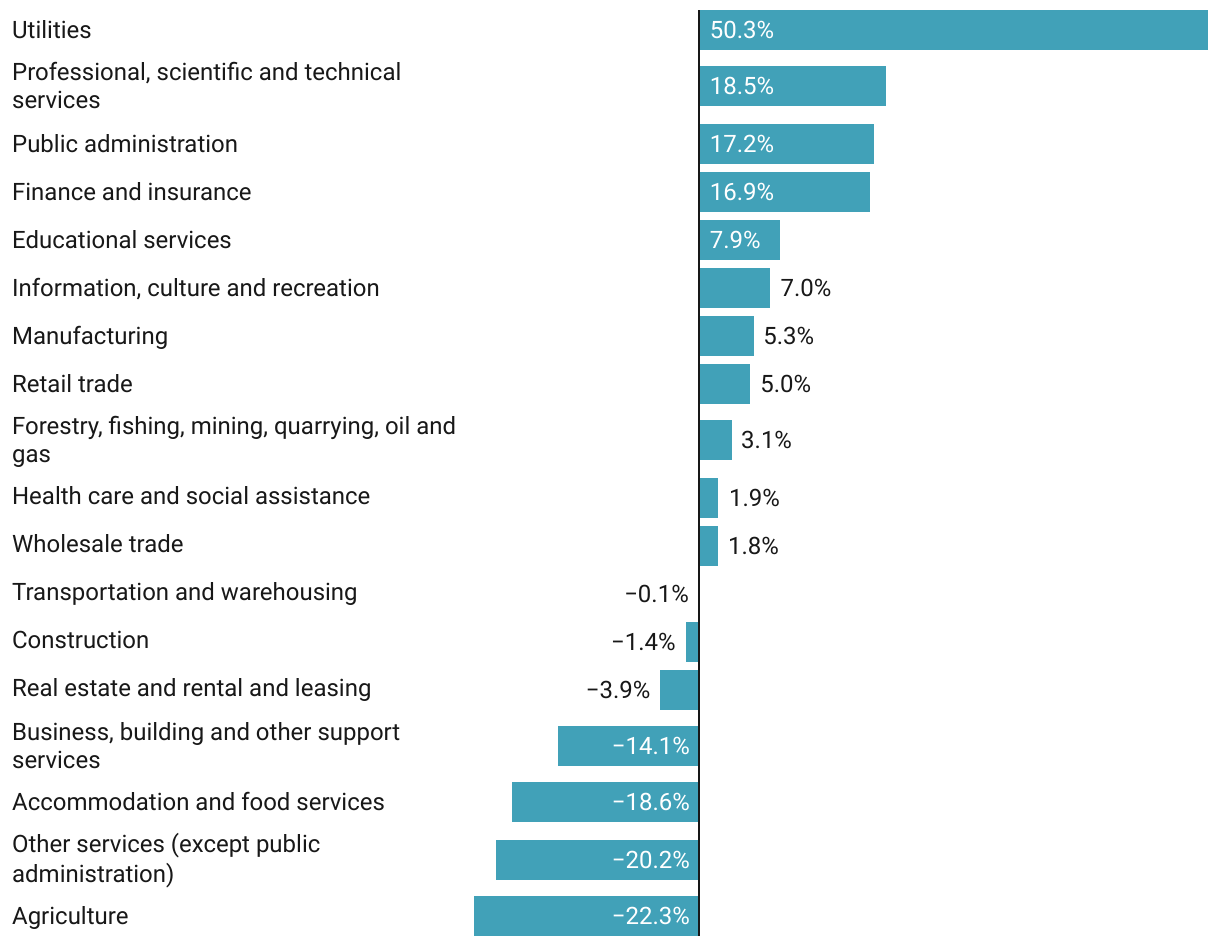
Change in employment among female workers (15+ yrs) by industry, Sept 2019 - Sept 2022
A bar chart that shows change in employment among female workers by industry between September 2019 and September 2022. The largest increases have been in utilities, professional services and public administration. By contrast, there has only been modest growth in health care and social assistance, and employment losses in accommodation and food services and other services such as personal care businesses.