Operating surplus and deficit
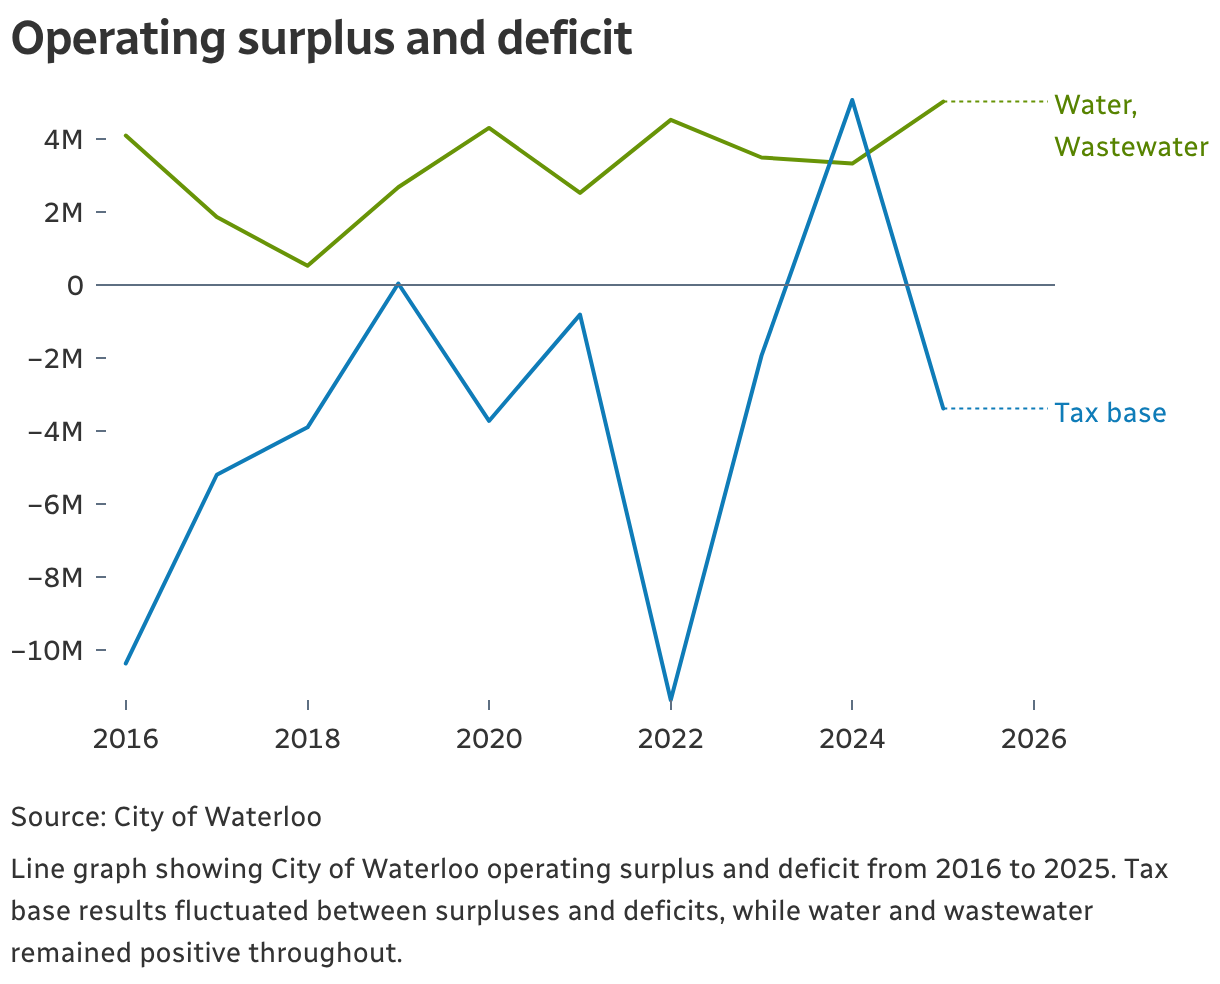
Line graph showing operating surplus and deficit from 2016 to 2025. Tax base results fluctuated between surpluses and deficits, while water and wastewater remained positive throughout.
(Please use a modern browser to see the interactive version of this visualization)