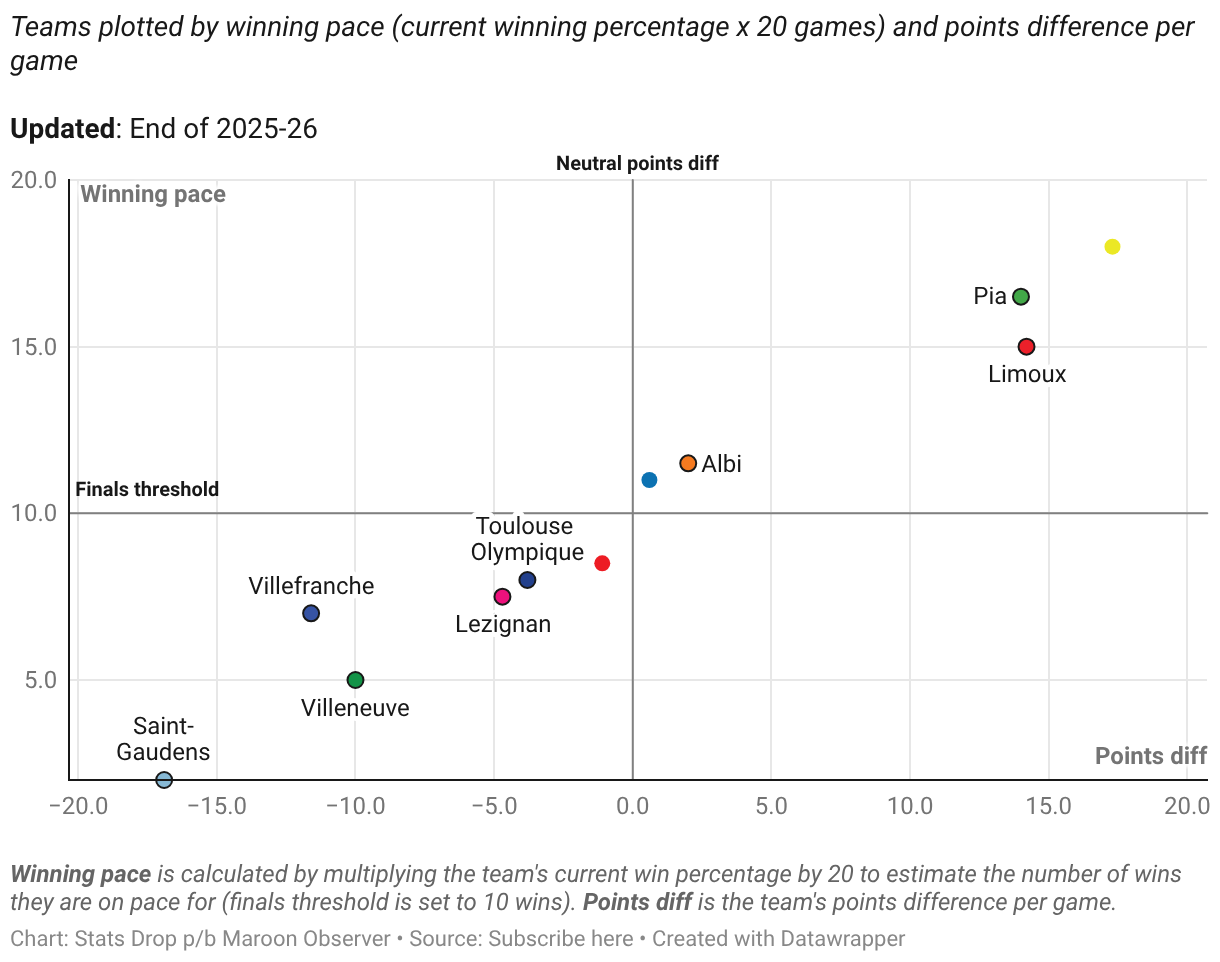
Teams plotted by winning pace (current winning percentage x 20 games) and points difference per game
Updated: End of 2025-26
Teams plotted by winning pace (current winning percentage x 20 games) and points difference per game
Updated: End of 2025-26