CSIRO’s Simple Carbon-Climate Model of atmospheric CO2 levels (ppm)
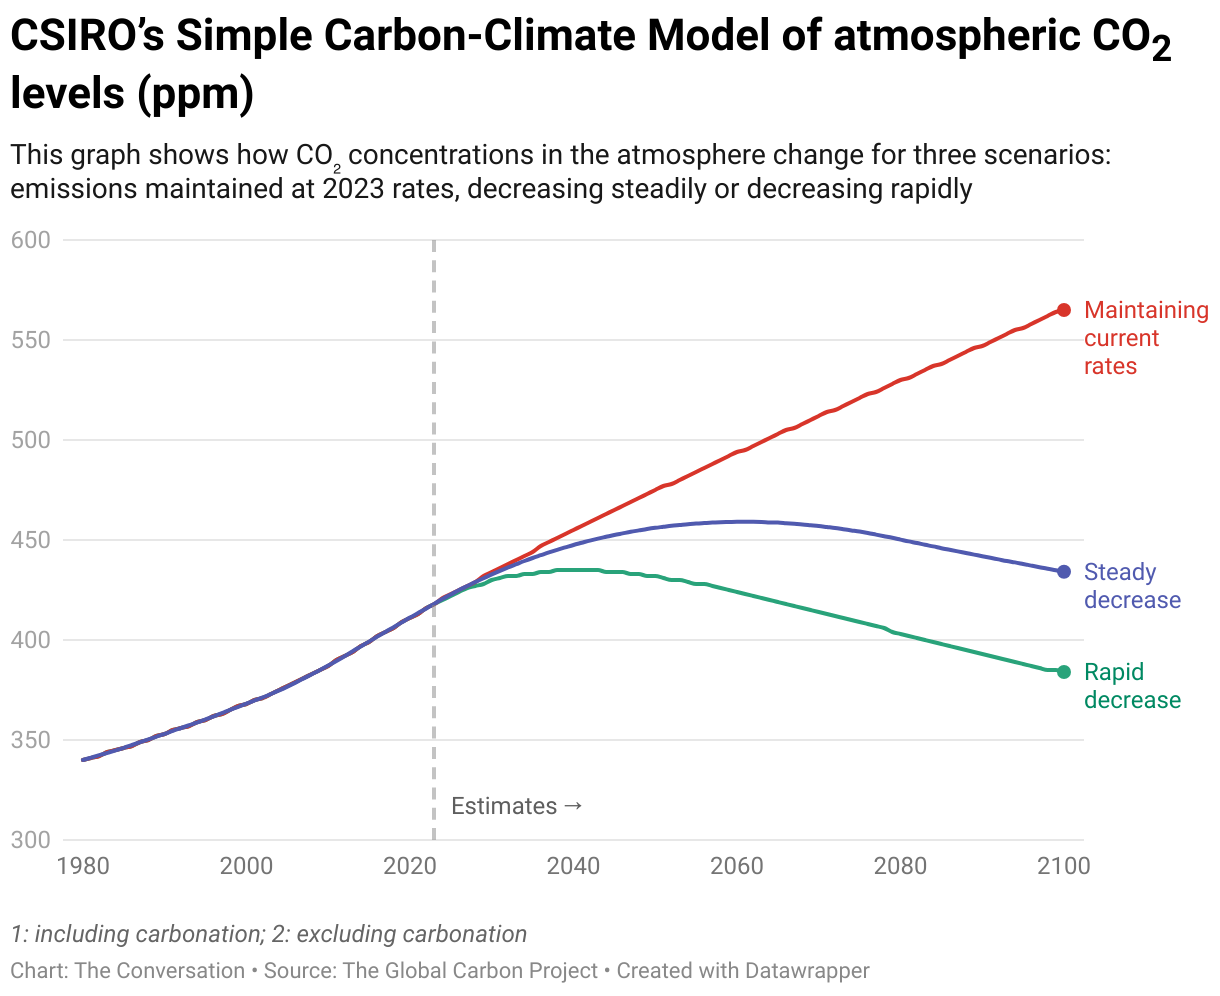
This graph shows how CO₂ concentrations in the atmosphere change for three scenarios: emissions maintained at 2023 rates, decreasing steadily or decreasing rapidly
This graph shows how CO₂ concentrations in the atmosphere change for three scenarios: emissions maintained at 2023 rates, decreasing steadily or decreasing rapidly
