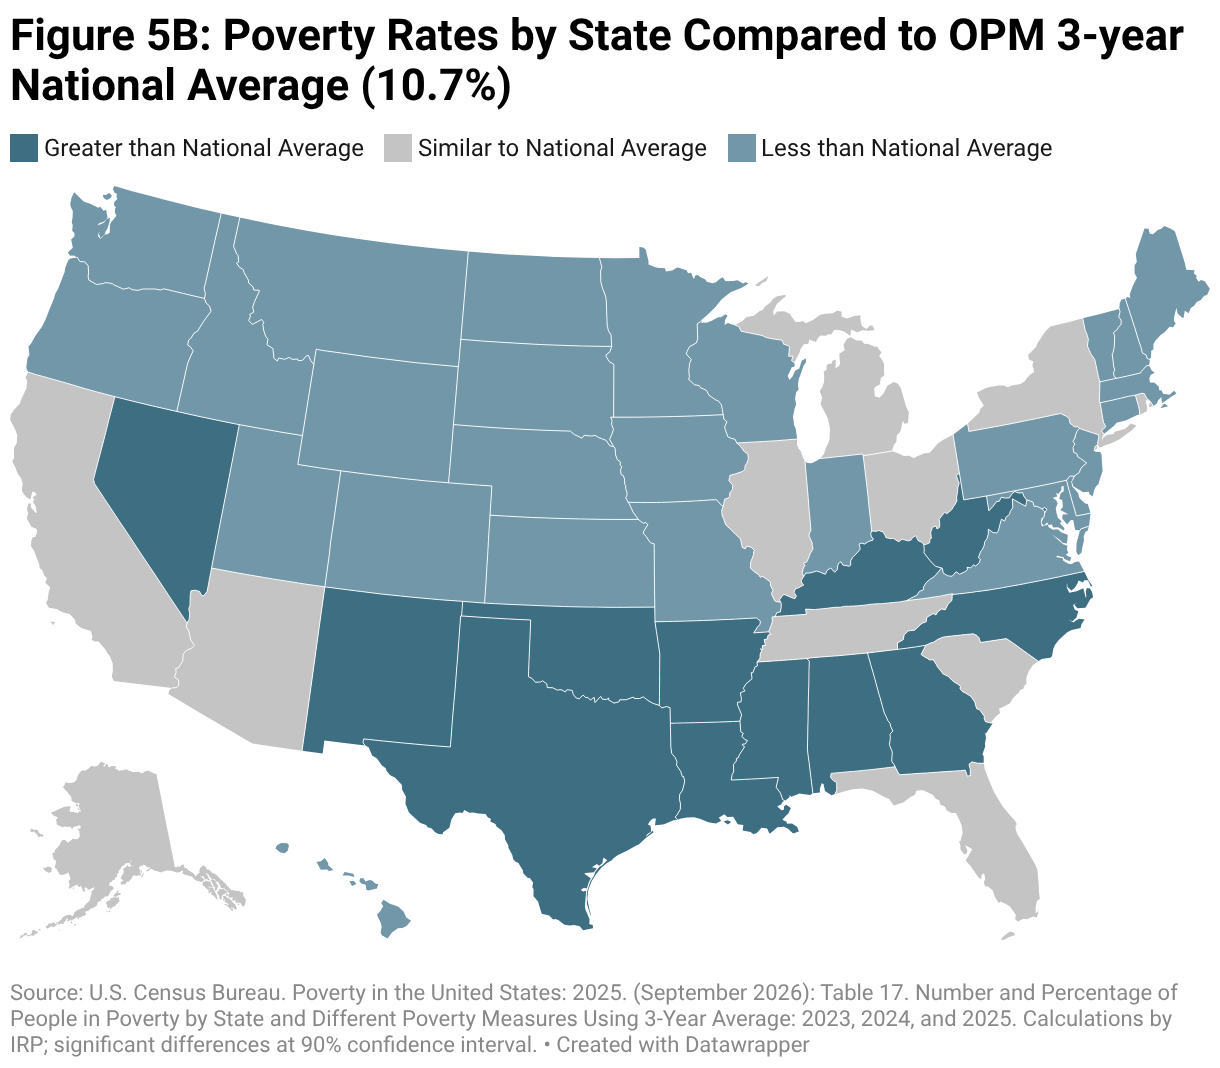
Figure 5B: Poverty Rates by State Compared to OPM 3-year National Average (10.7%)

Source: U.S. Census Bureau. Poverty in the United States: 2025. (September 2026): Table 17. Number and Percentage of People in Poverty by State and Different Poverty Measures Using 3-Year Average: 2023, 2024, and 2025. Calculations by IRP; significant differences at 90% confidence interval.Get the dataDownload image