Local authority spending on children’s services, by type, 2009/10–2023/24 (2025/26 prices)

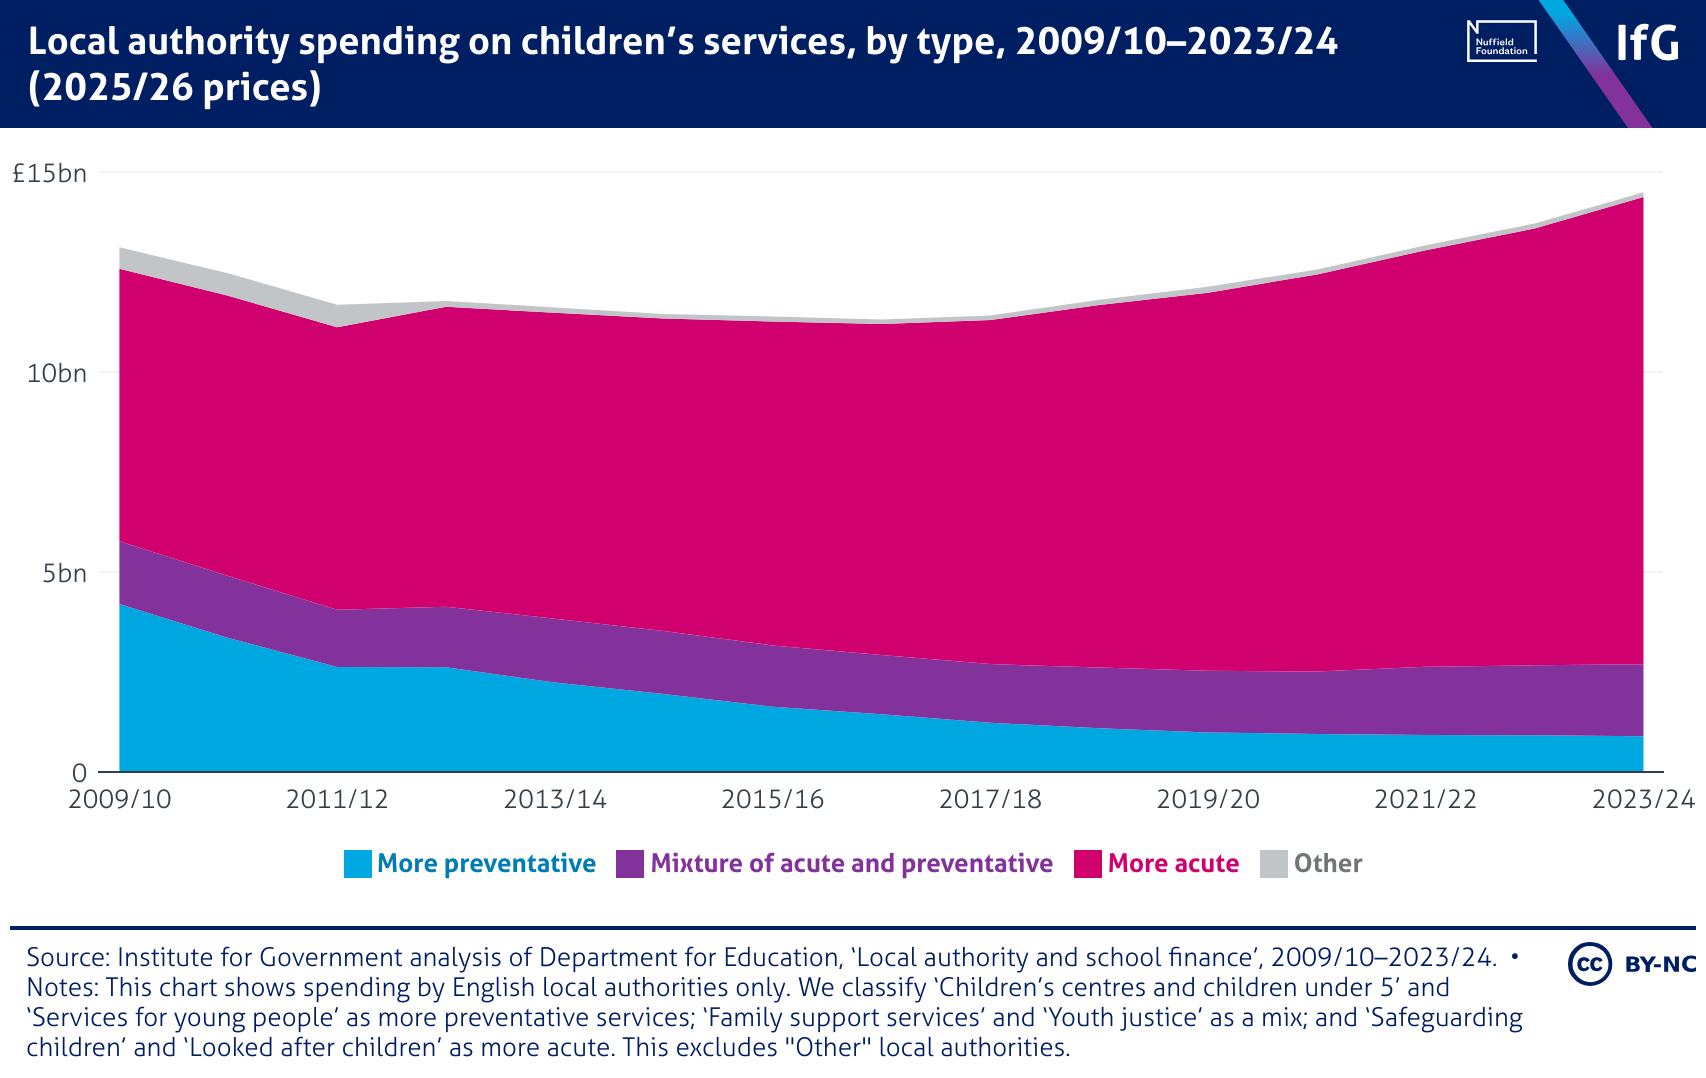
A stacked area chart from the Institute for Government of local authority spending on children’s services, by type, 2009/10–2023/24 (2025/26 prices), where spending on acute services forms the largest share and has continued to grow, while spending on preventative services has declined and now forms a significantly smaller share of total spending.

