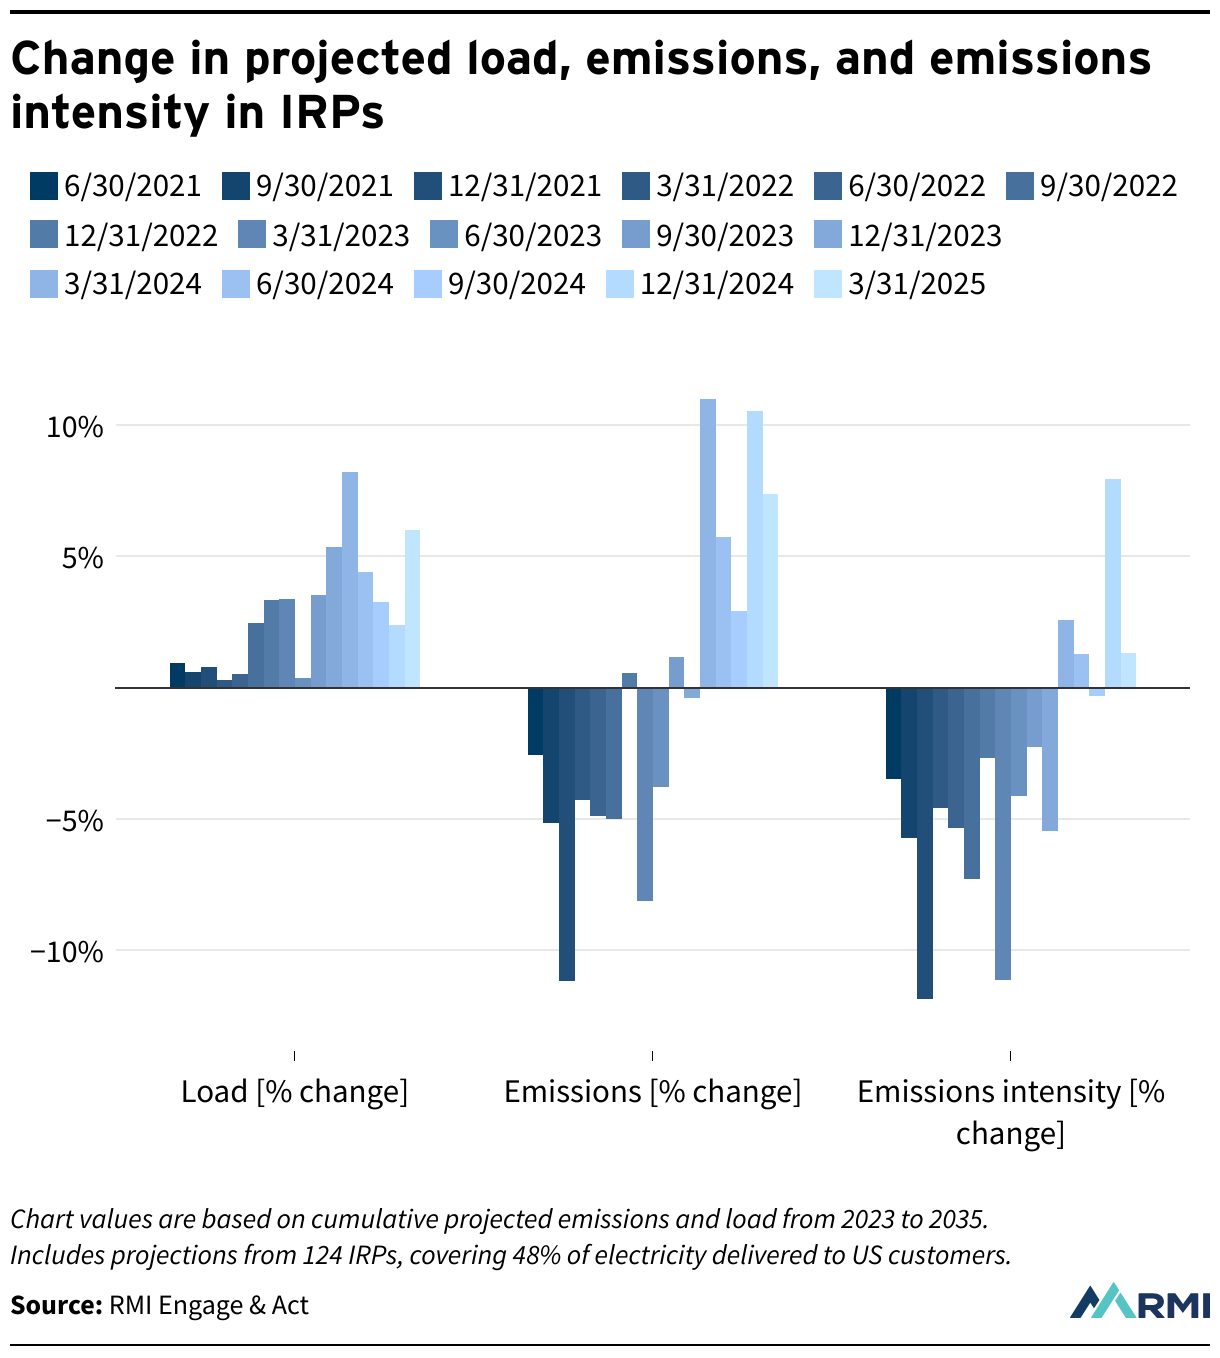
Change in projected load, emissions, and emissions intensity in IRPs
(Please use a modern browser to see the interactive version of this visualization)
