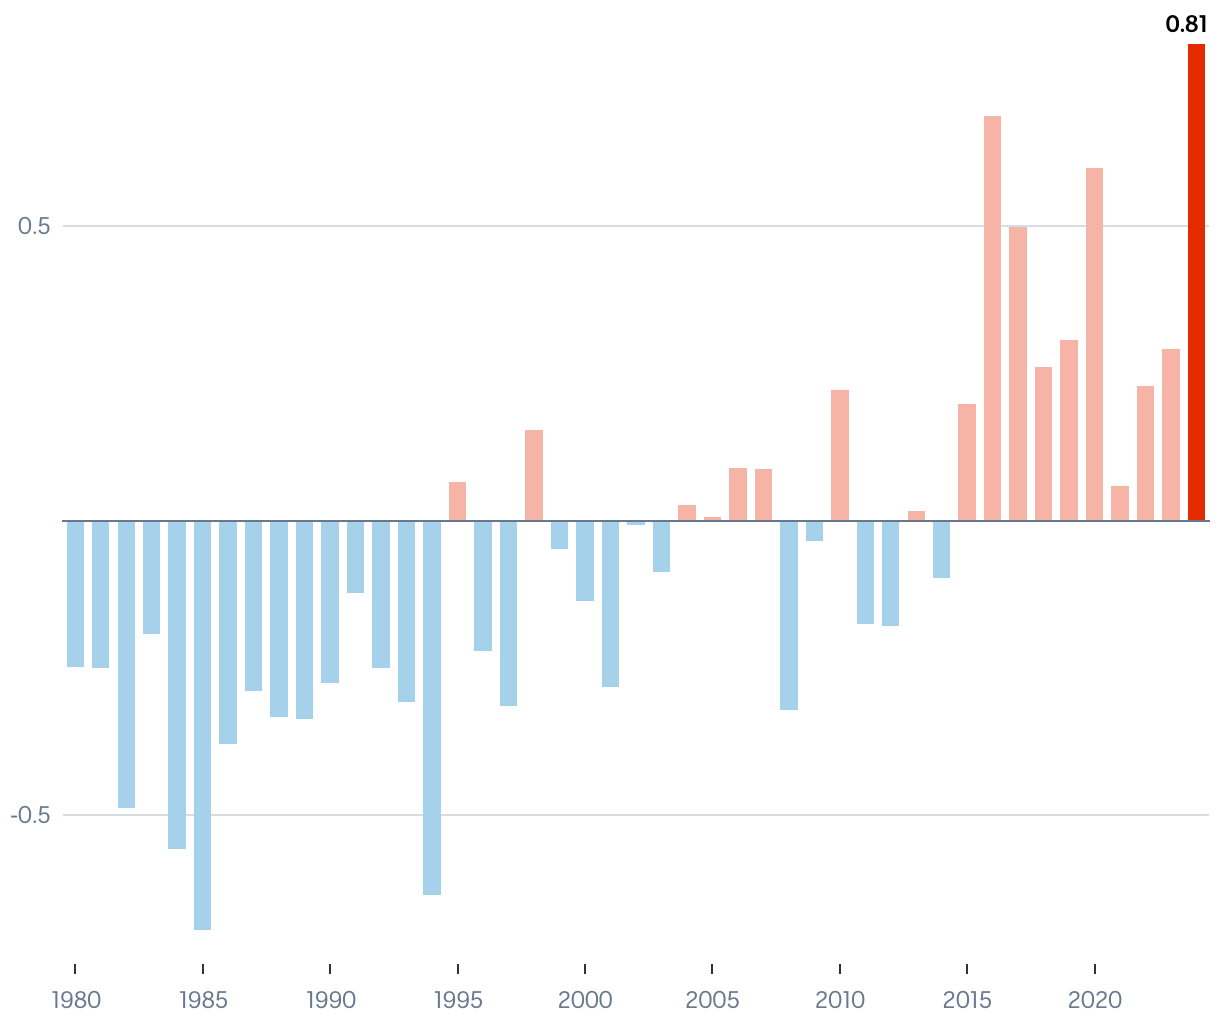
The chart shows global surface air temperature anomalies for every February since 1980.
(Please use a modern browser to see the interactive version of this visualization)