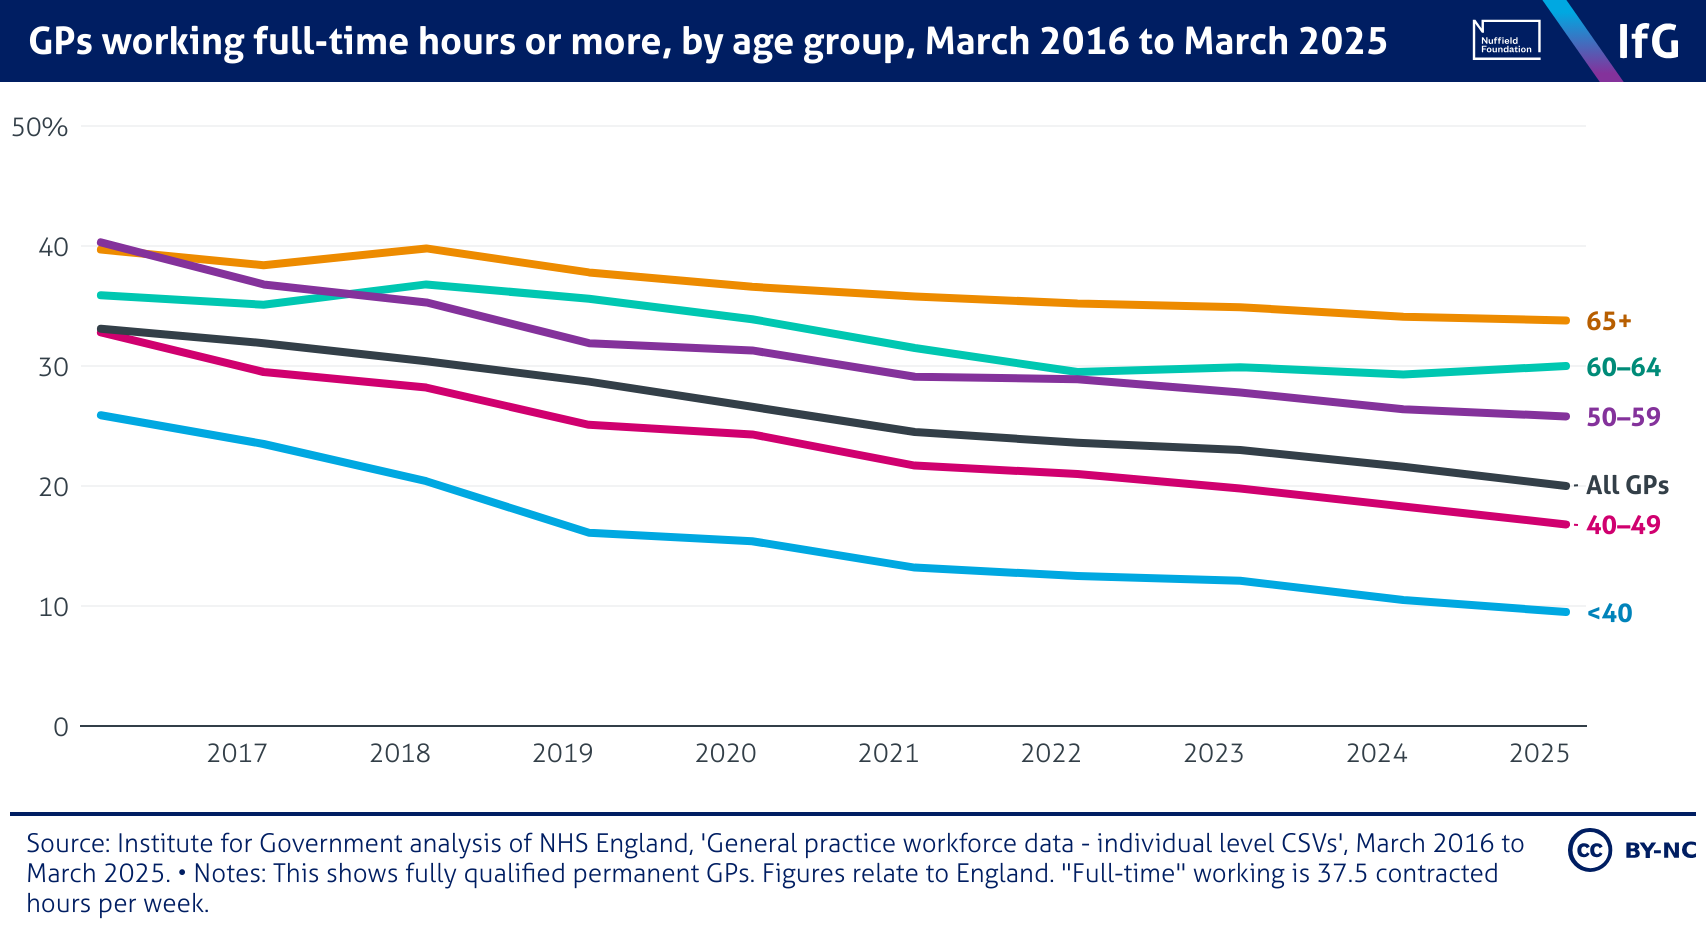
GPs working full-time hours or more, by age group, March 2016 to March 2025

A line chart from the Institute for Government showing GPs working full-time hours or more, by age group, March 2016 to March 2025, where the share of GPs working full time has declined across all age groups. The proportion of all GPs working full time fell from 33.1% in 2016 to 20% in 2025, with the steepest drop among those under 40, down from 25.9% to 9.5%. Older GPs aged 65+ remain the most likely to work full time, though their rate also fell slightly from 39.7% to 33.8%.

