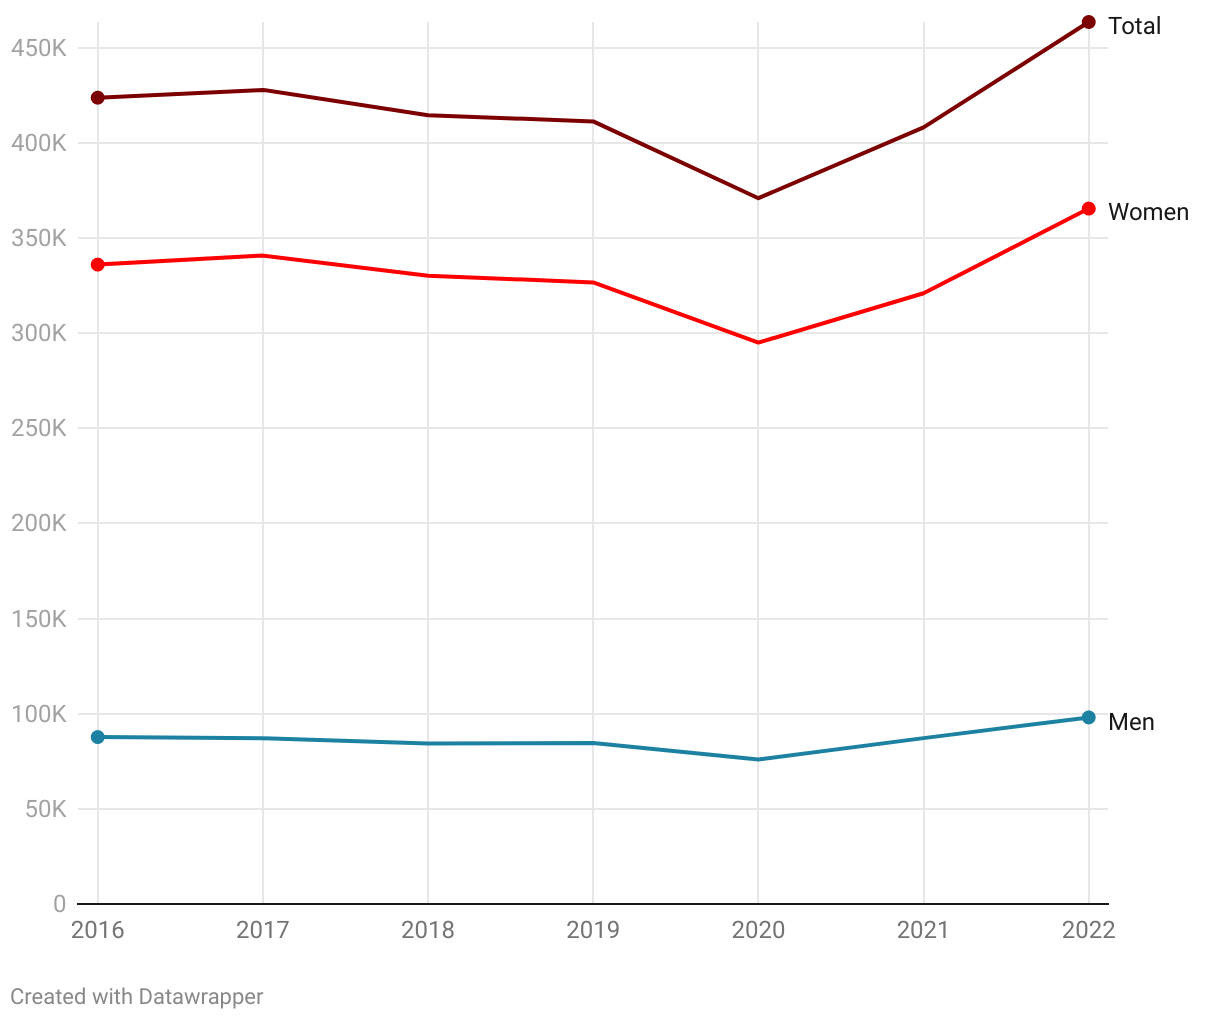
Sick-leave due to stress in Sweden, by gender:
This line chart represents the increasing gap between men and women regarding sick-leave due to stress (diagnosis F43), with a slight decline in 2020 due to the COVID-19 pandemic.
This line chart represents the increasing gap between men and women regarding sick-leave due to stress (diagnosis F43), with a slight decline in 2020 due to the COVID-19 pandemic.
Y axis: number of workers on sick-leave due to stress. X axis: years.
The data of 2022 is only available until November 2022.