Units Under Construction in Q1, 2025 / Total Units (Big Markets)
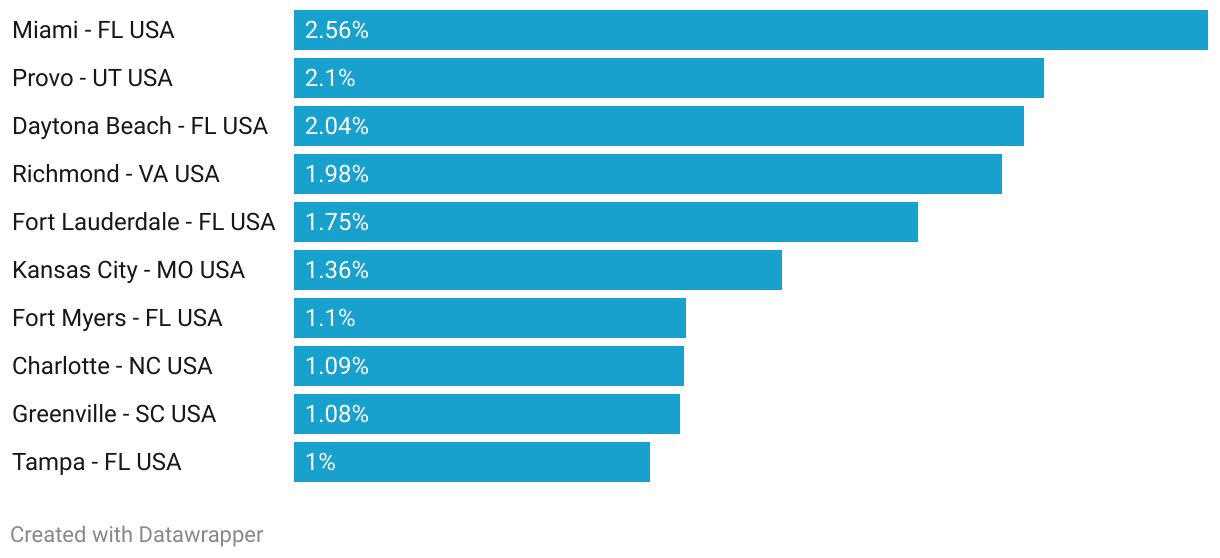
This chart shows the big metropolitan areas that have the most multifamily units that have started construction in Q1, 2025 relative to total existing multifamily housing supply.
This chart shows the big metropolitan areas that have the most multifamily units that have started construction in Q1, 2025 relative to total existing multifamily housing supply.