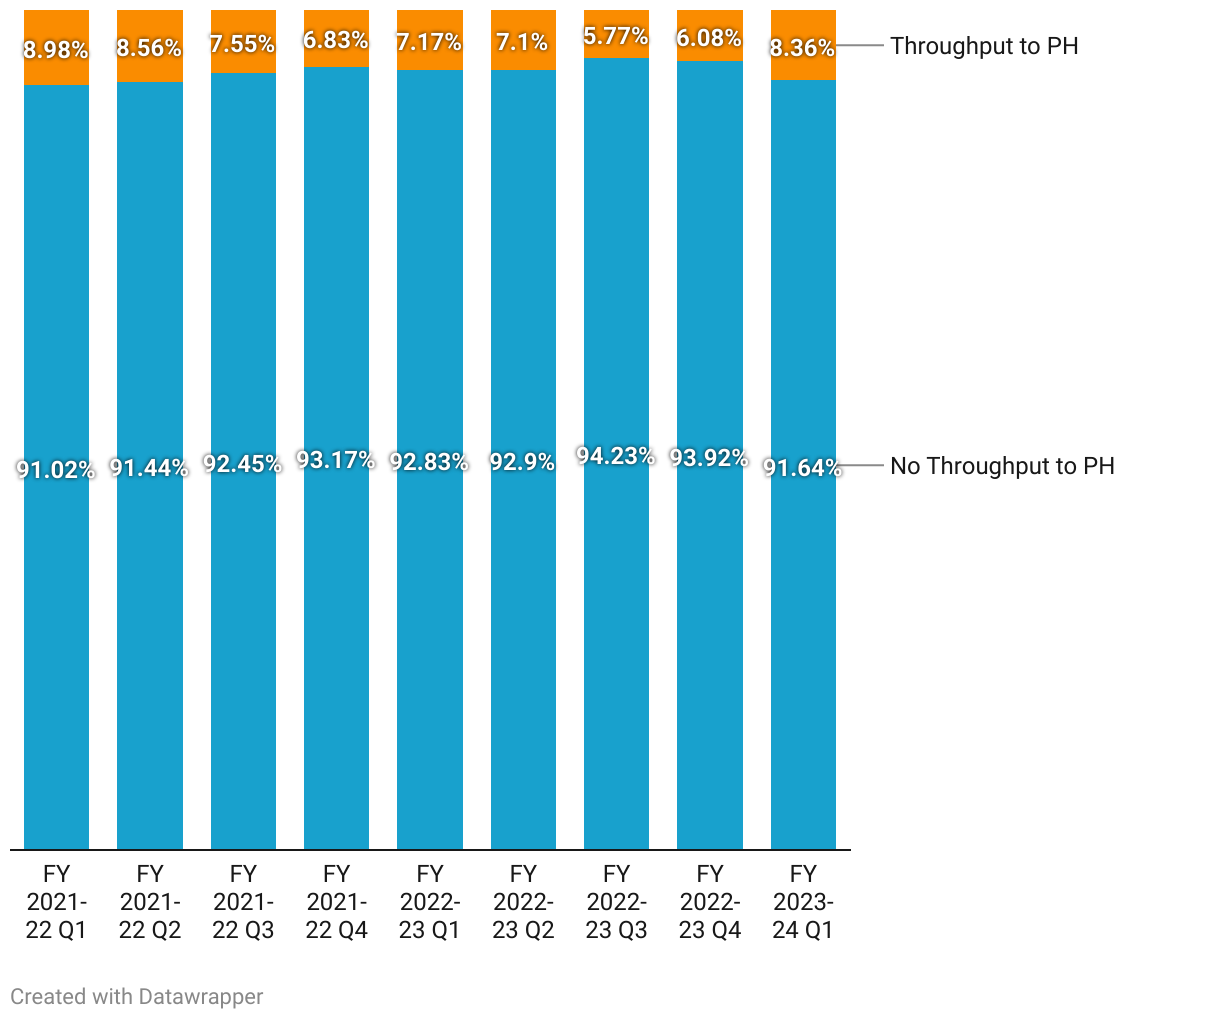
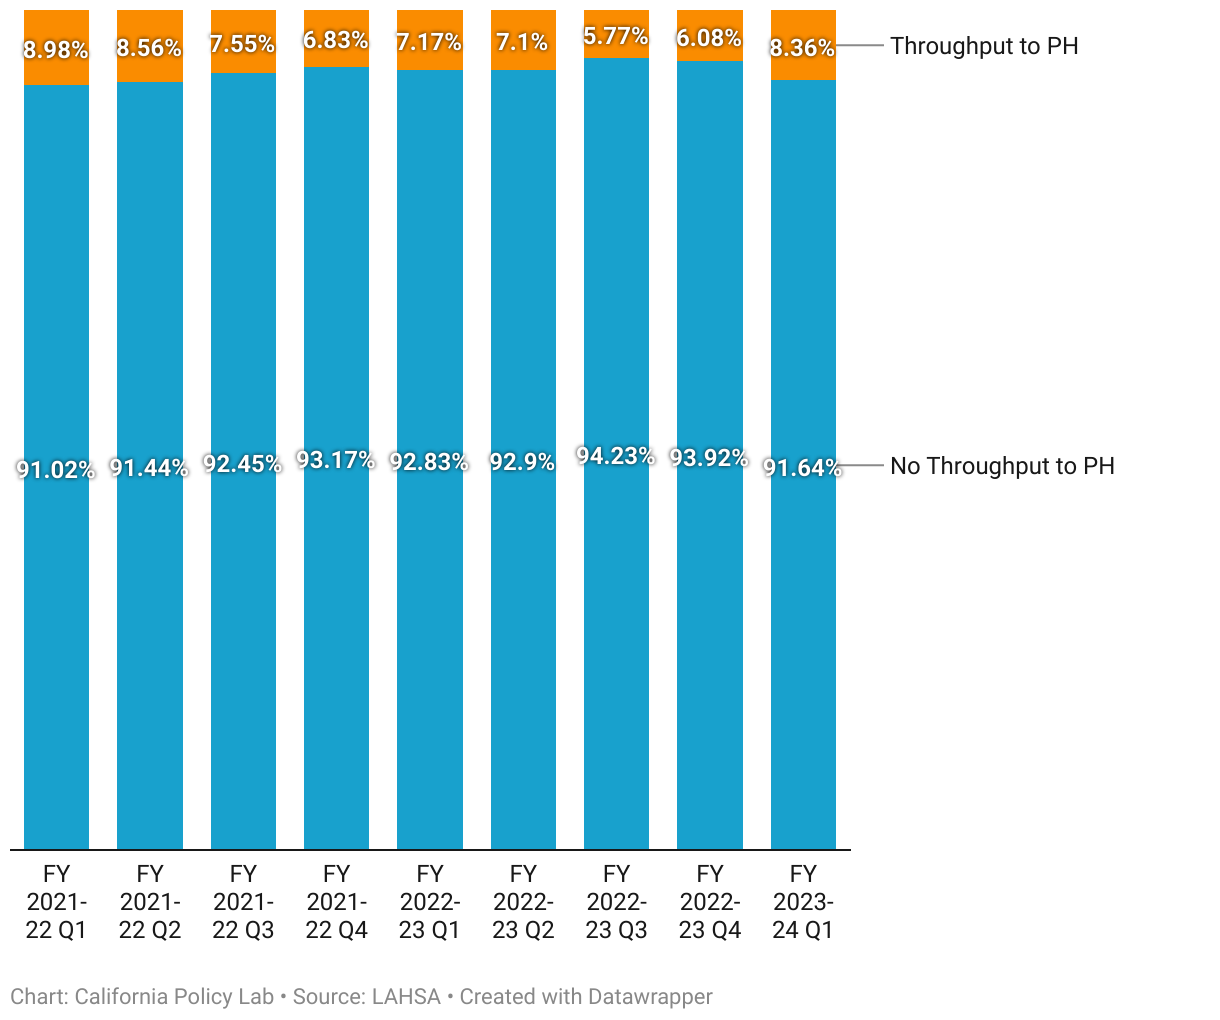
This simple bar chart shows the share of adults who transition each quarter from interim housing to permanent housing, from the time period of FY 2021-22, Q1, through FY 2023-24, Q1.
(Please use a modern browser to see the interactive version of this visualization)