2020 Turnout and Vote in Under-Performing County Types
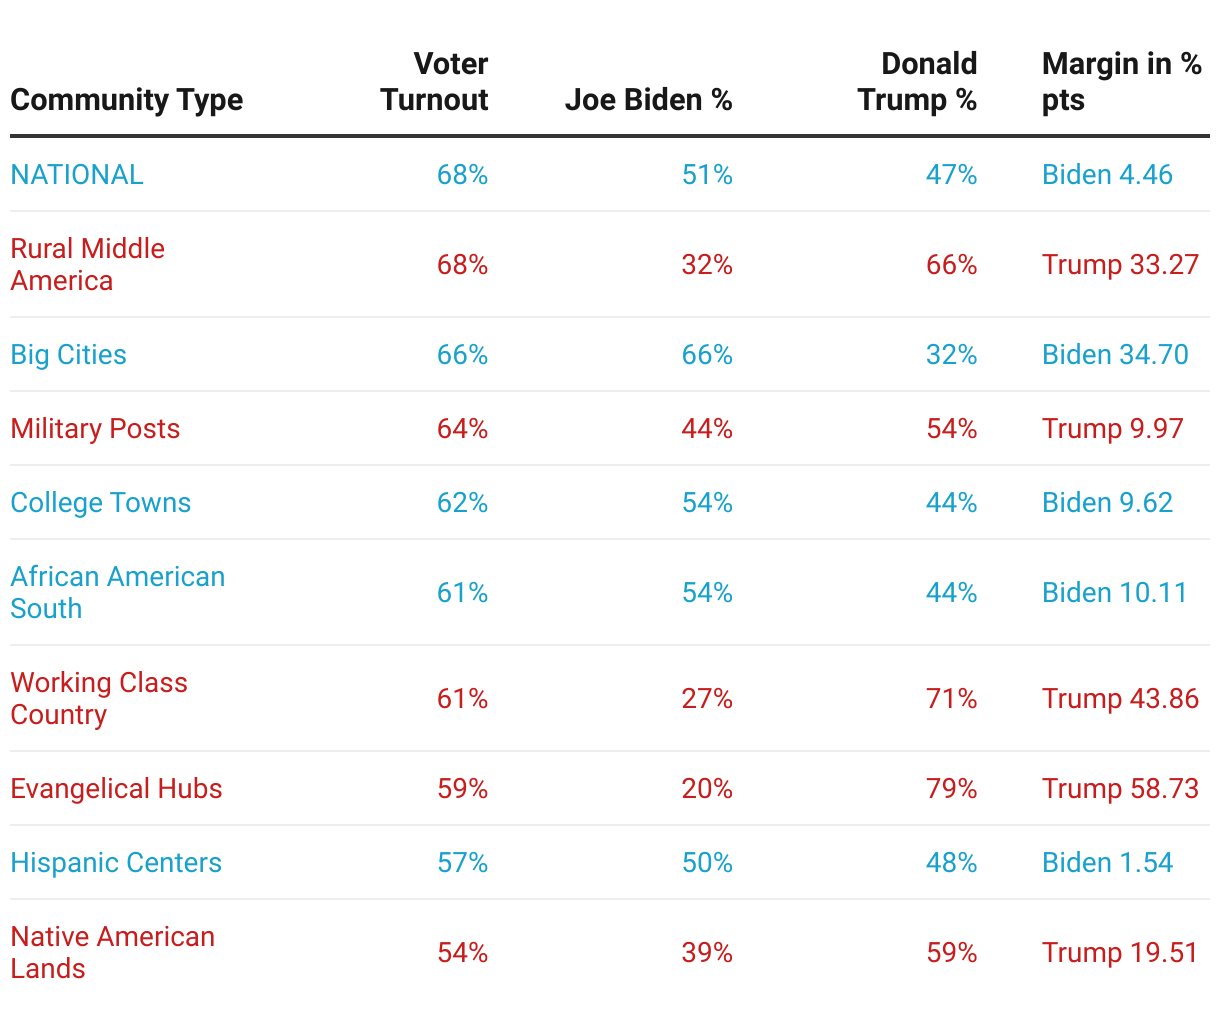
The table shows the eligible voter turnout and the winner and margin for each of the ACP types where voter turnout was under the national average.
The table shows the eligible voter turnout and the winner and margin for each of the ACP types where voter turnout was under the national average.