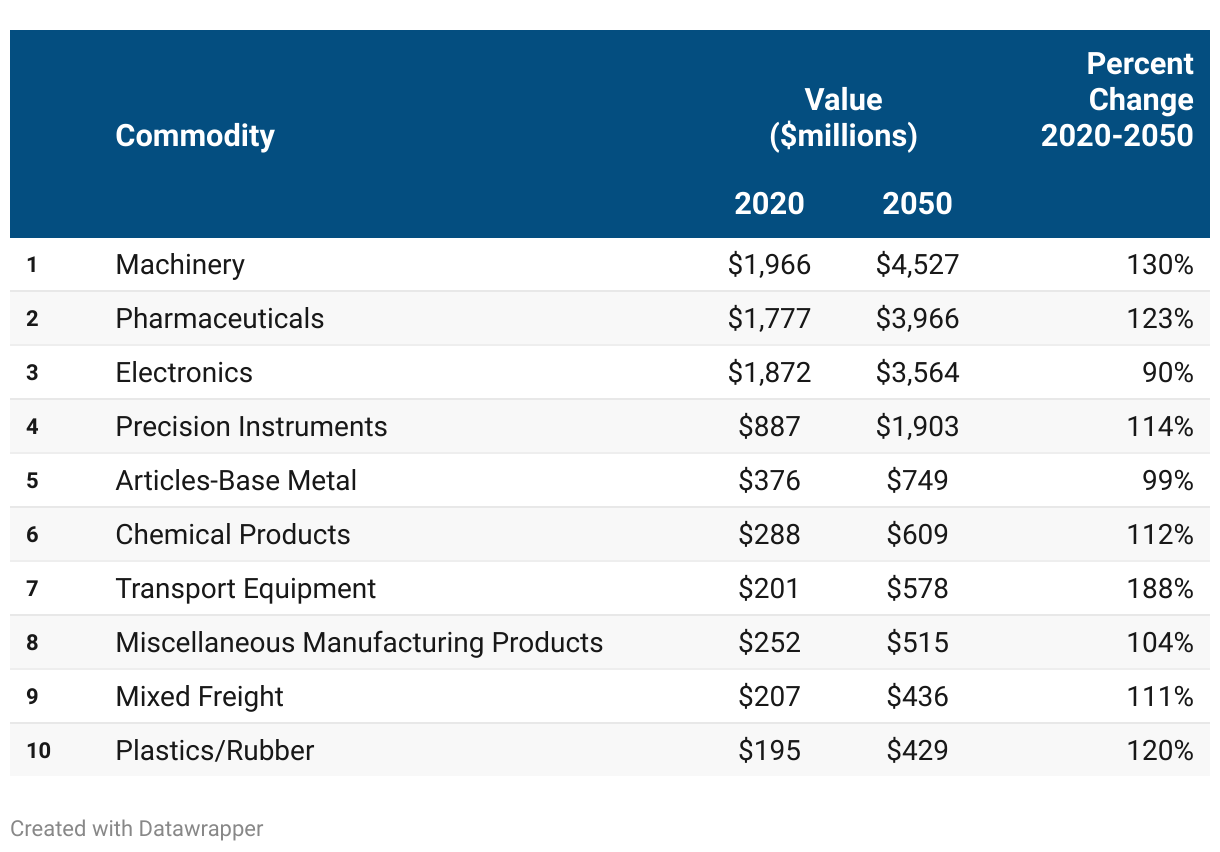
Top 10 Commodities by Value, 2020 and 2050
Table includes five columns for ranking order (1 to 10), Commodity, Value in 2020 and 2050, and Percent Change in value between 2020 to 2050. Ten rows include the data values for these five columns for top 10 commodities transported by air in the OKI region.