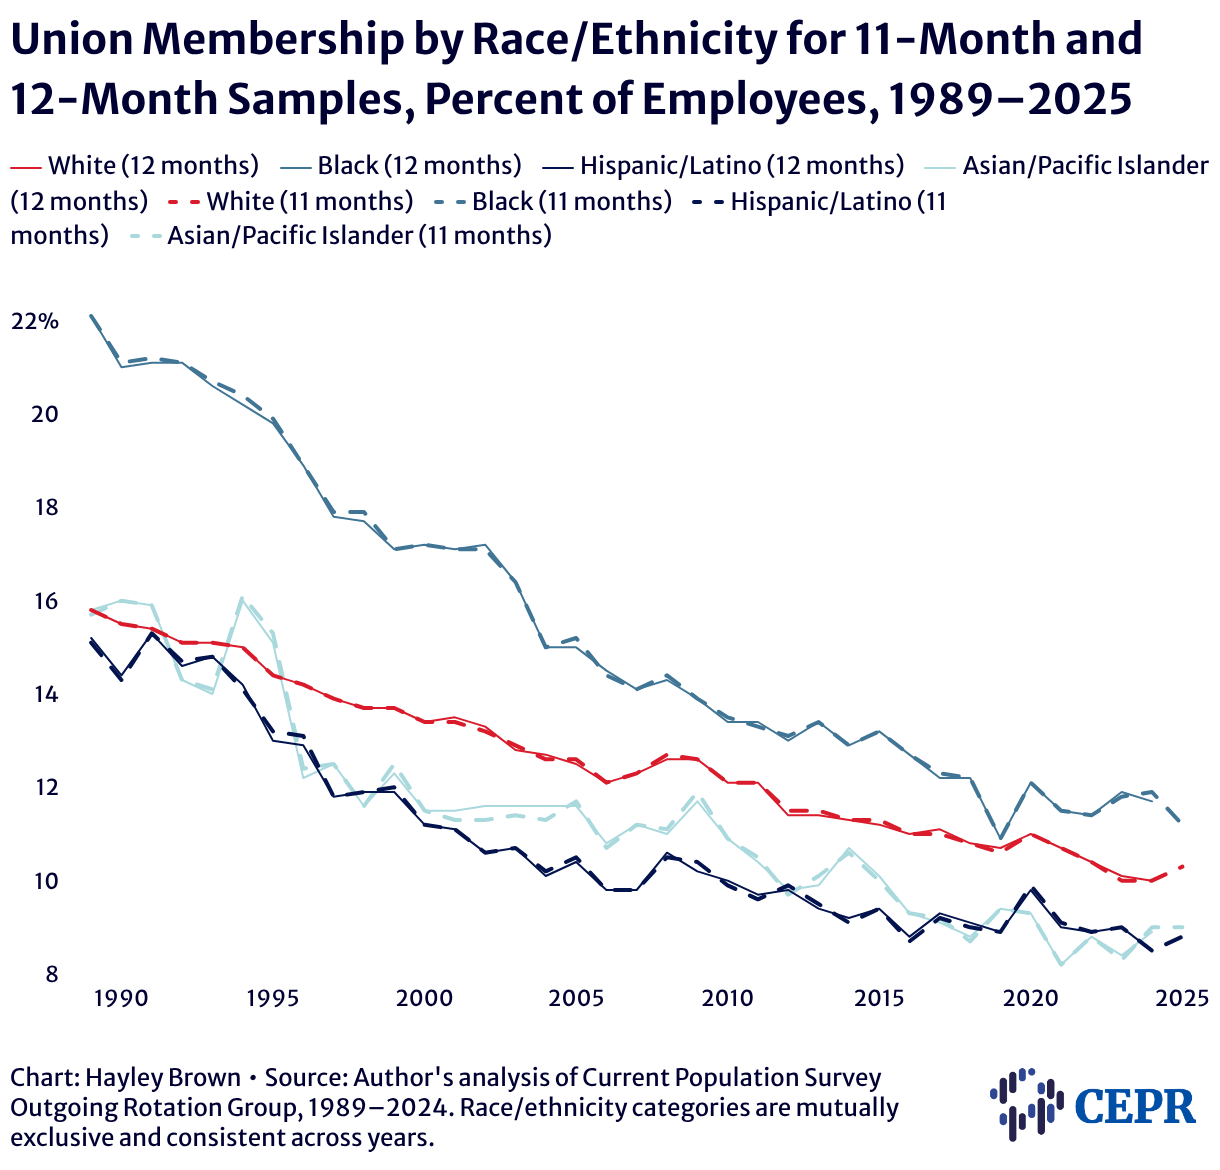
Union Membership by Race/Ethnicity for 11-Month and 12-Month Samples, Percent of Employees, 1989–2025
Line chart comparing union membership rates by race and ethnicity using 12-month (solid) and 11-month (dashed) samples from 1989 to 2025. Black is blue, White red, Hispanic/Latino navy, and Asian/Pacific Islander light teal. Dashed lines closely follow solid lines for all groups.
