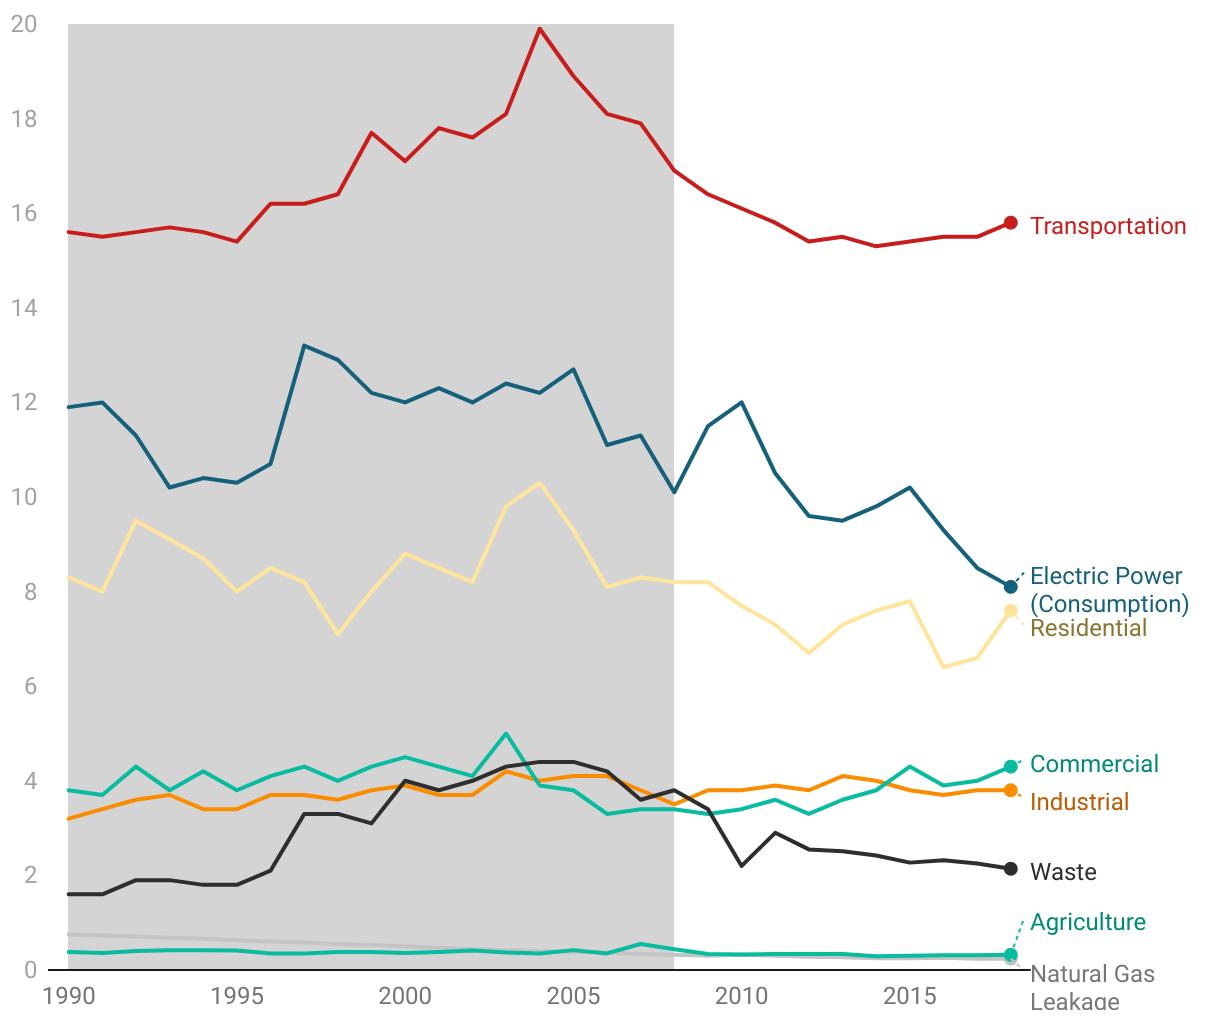
Overall greenhouse gas emissions have fallen
Data after the shaded area represents the most recent 10 years of available data regarding greenhouse gas emissions.
Data after the shaded area represents the most recent 10 years of available data regarding greenhouse gas emissions.