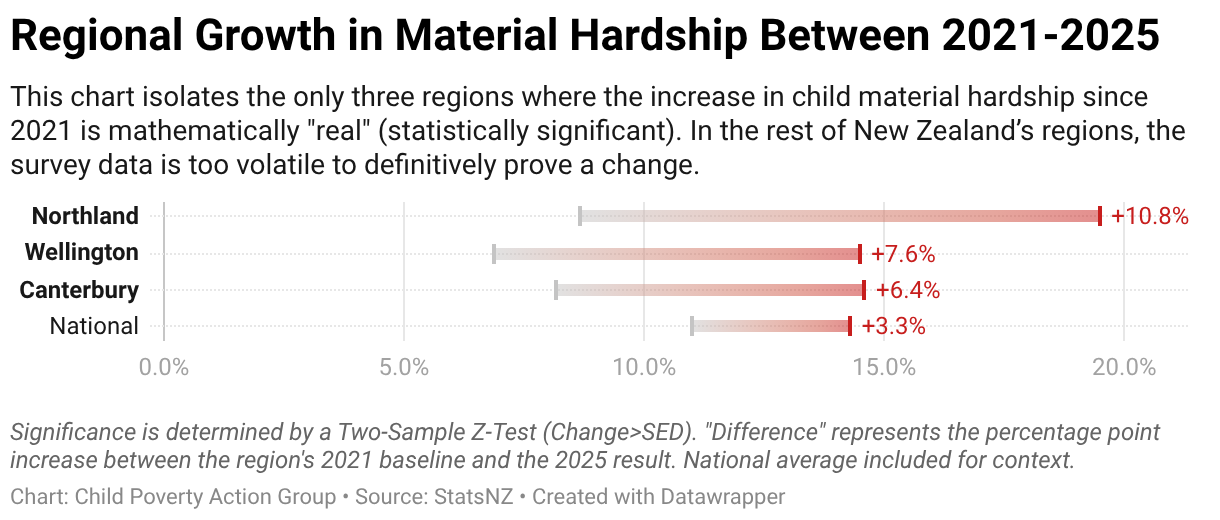
Regional Growth in Material Hardship Between 2021-2025
This chart isolates the only three regions where the increase in child material hardship since 2021 is mathematically "real" (statistically significant). In the rest of New Zealand’s regions, the survey data is too volatile to definitively prove a change.
