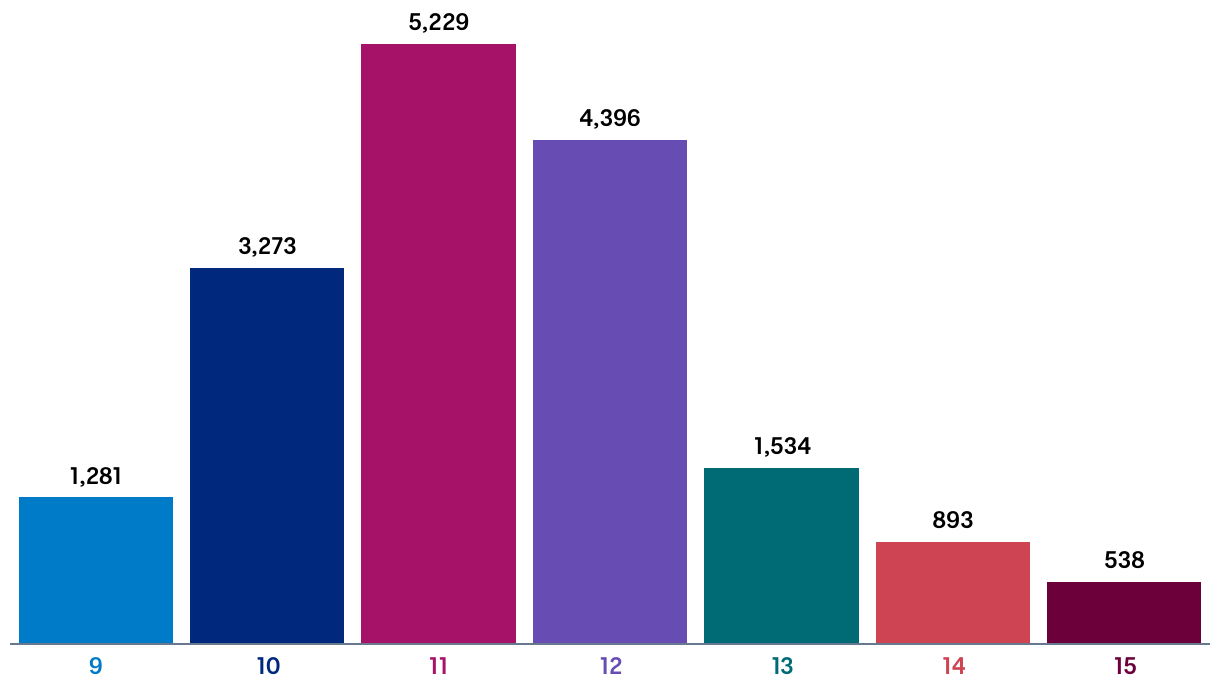
Survey respondents by age
A column chart showing the different age groups that responded to a survey, with 11 year olds being the highest.
(Please use a modern browser to see the interactive version of this visualization)