Accounting for Population Changes, Very Few States' Public Sectors Recovered After Great Recession
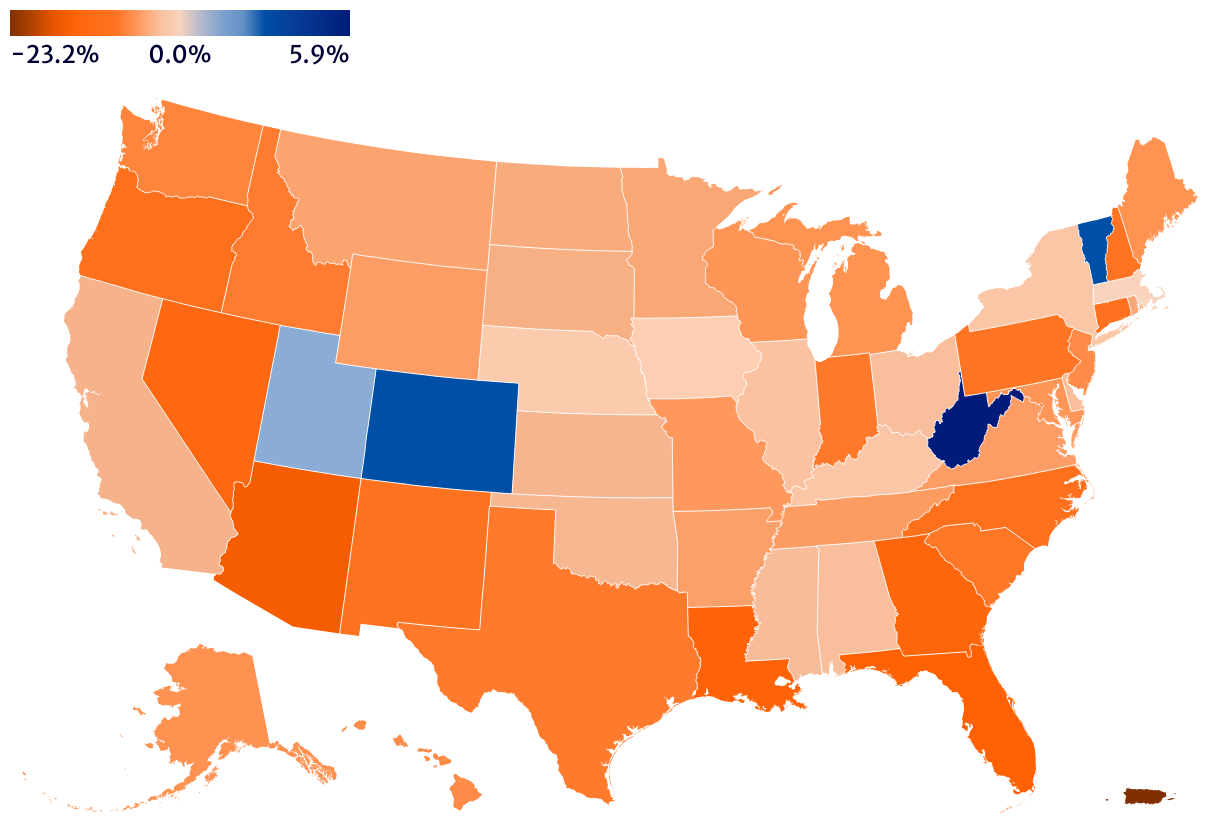
Population-Adjusted Percent Change in State and Local Government Employment, 2008–2019
This figure, Figure 5, shows the population-adjusted percent change in state and local government employment between 2008 and 2019 by state and territory. It includes information for the 50 US states, the District of Columbia, and Puerto Rico. States and territories that experienced a per capita increase in their state and local government workforces are shown in shades of blue, with darker shades indicating a higher percent change. States and territories that saw a per capita decrease in their state and local government workforces are shown in shades of orange, with darker orange indicating a greater percent decline. In 2019, just four states surpassed their 2008 population-weighted public sector workforces: West Virginia (5.9 percent), Vermont (2.9 percent), Colorado (2.9 percent), and Utah (1.1 percent). Massachusetts (0.0 percent) was at parity. Puerto Rico experienced the largest population-adjusted decline (just over 23 percent).
Source: Authors' analysis of State and Area Employment, Hours, and Earnings data, US Bureau of Labor Statistics, 2008–2019. Population adjustments are based on the Intercensal Estimates of the Resident Population by Sex and Age for the United States, US Census Bureau, 2008, and Annual Estimates of the Resident Population for Selected Age Groups by Sex, US Census Bureau, 2019.