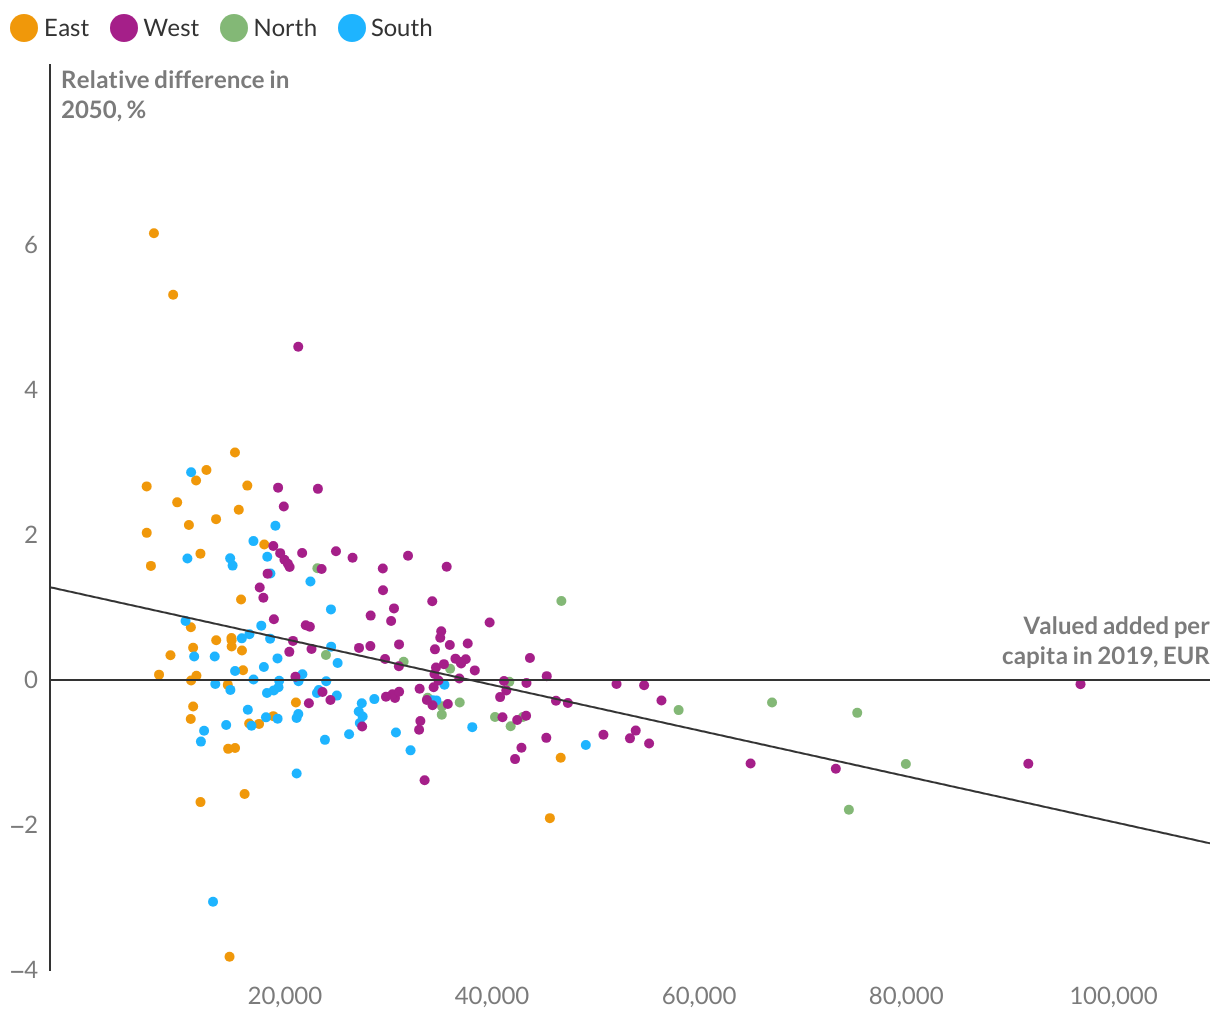
Benefits in value added highest for lagging regions

This figure displays the initial value added per capita in 2019 on the x-axis and the change (in percentage) in value added capita in a scenario of a fully-fledged renewable energy transition in 2050 on the y-axis.
Get the data Embed
Bertelsmann Stiftung