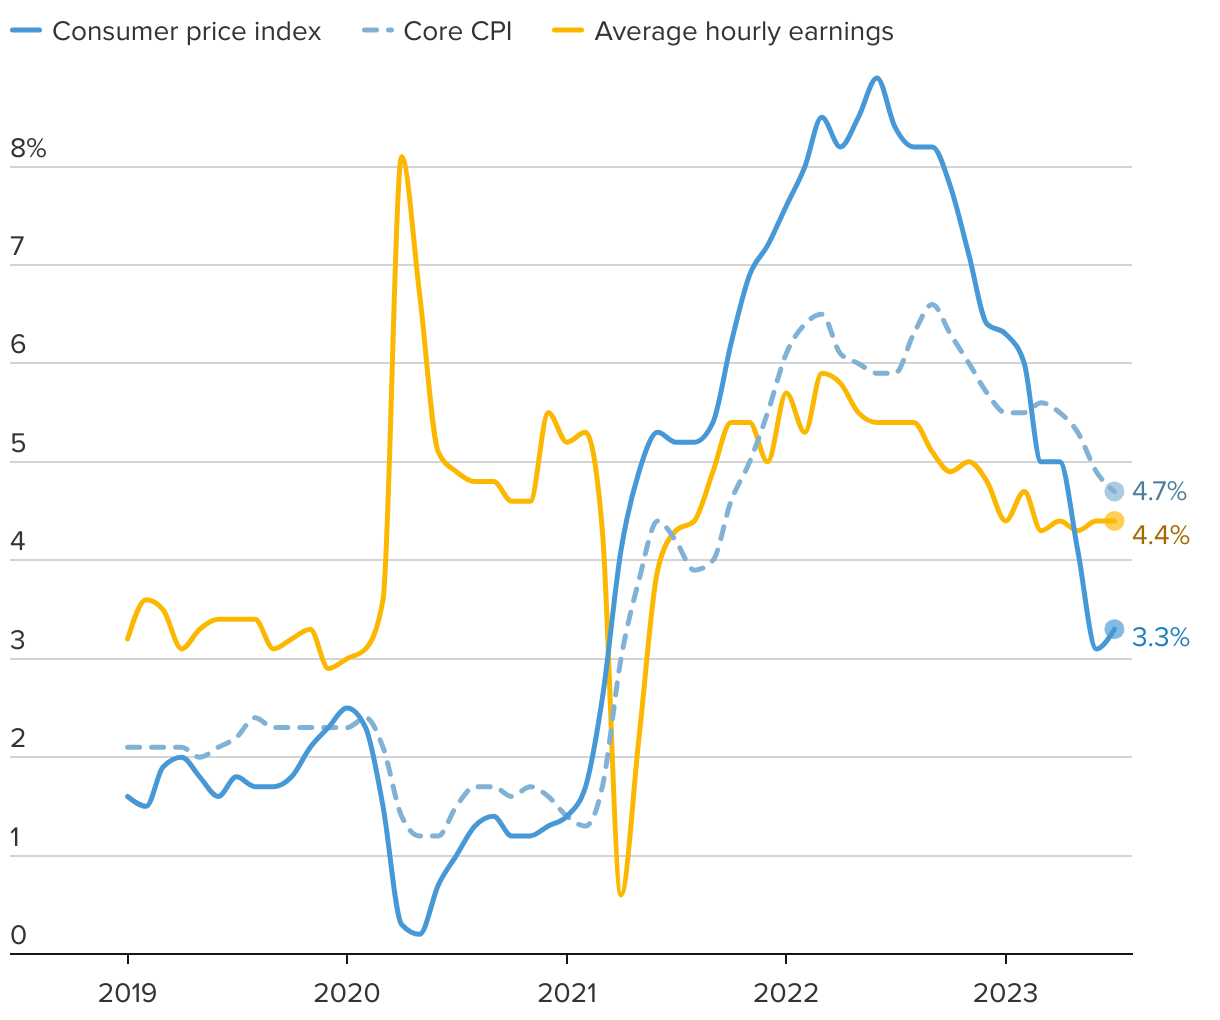
U.S consumer price index and average hourly earnings
Year-over-year percent change as of July 2023
The line chart shows the year-over-year percent change for the U.S consumer price index, both for all items and all items less food and energy, and average hourly earnings.