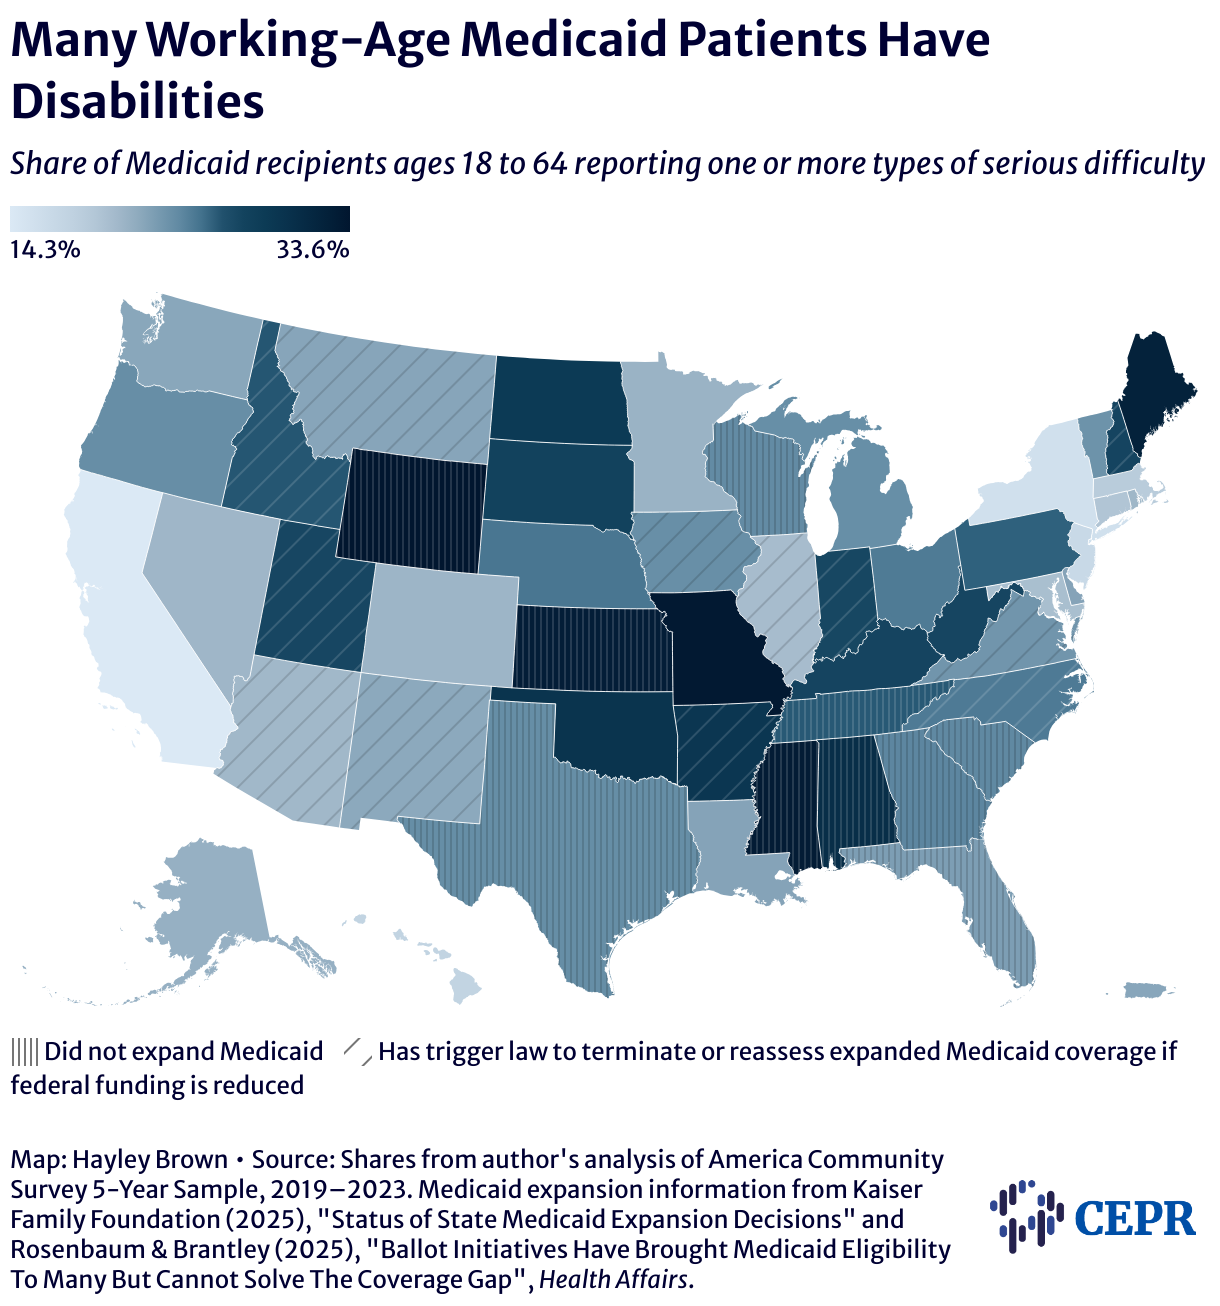
Many Working-Age Medicaid Patients Have Disabilities
Share of Medicaid recipients ages 18 to 64 reporting one or more types of serious difficulty
This map shows the share of working-age adult Medicaid recipients with disabilities between 2019 and 2023 in the 50 states, DC, and Puerto Rico. Darker shades of blue correspond with higher shares. It also notes which states opted to expand Medicaid under the Affordable Care Act, and which expansion states have trigger laws to terminate or reassess the expanded coverage should federal funding drop below a certain threshold.
