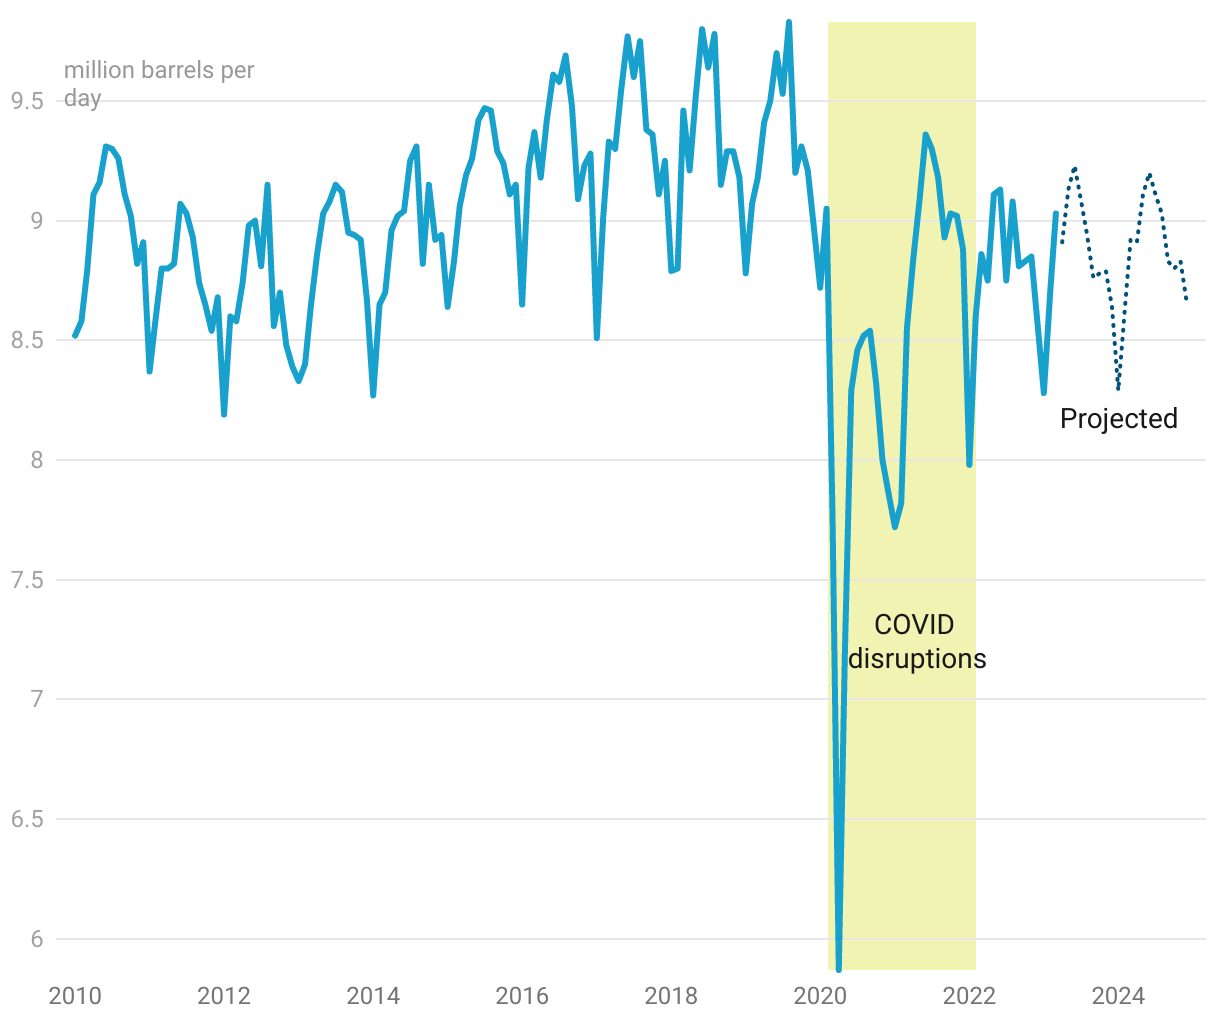
U.S. gasoline use has not rebounded from pandemic lows
A line graph showing gasoline use from 2010 through March of 2023, with two additional years of projected data.
The graph shows a strong peak of gasoline use in the summer, followed by a dip in the winter. The years 2016 through 2019 had the highest use.
Then the Covid-19 pandemic severely reduced demand for over a year. In January 2022, the typical seasonal pattern re-emerges, but at a lower level. Two years of projected data show gasoline use remaining lower than pre-pandemic levels.