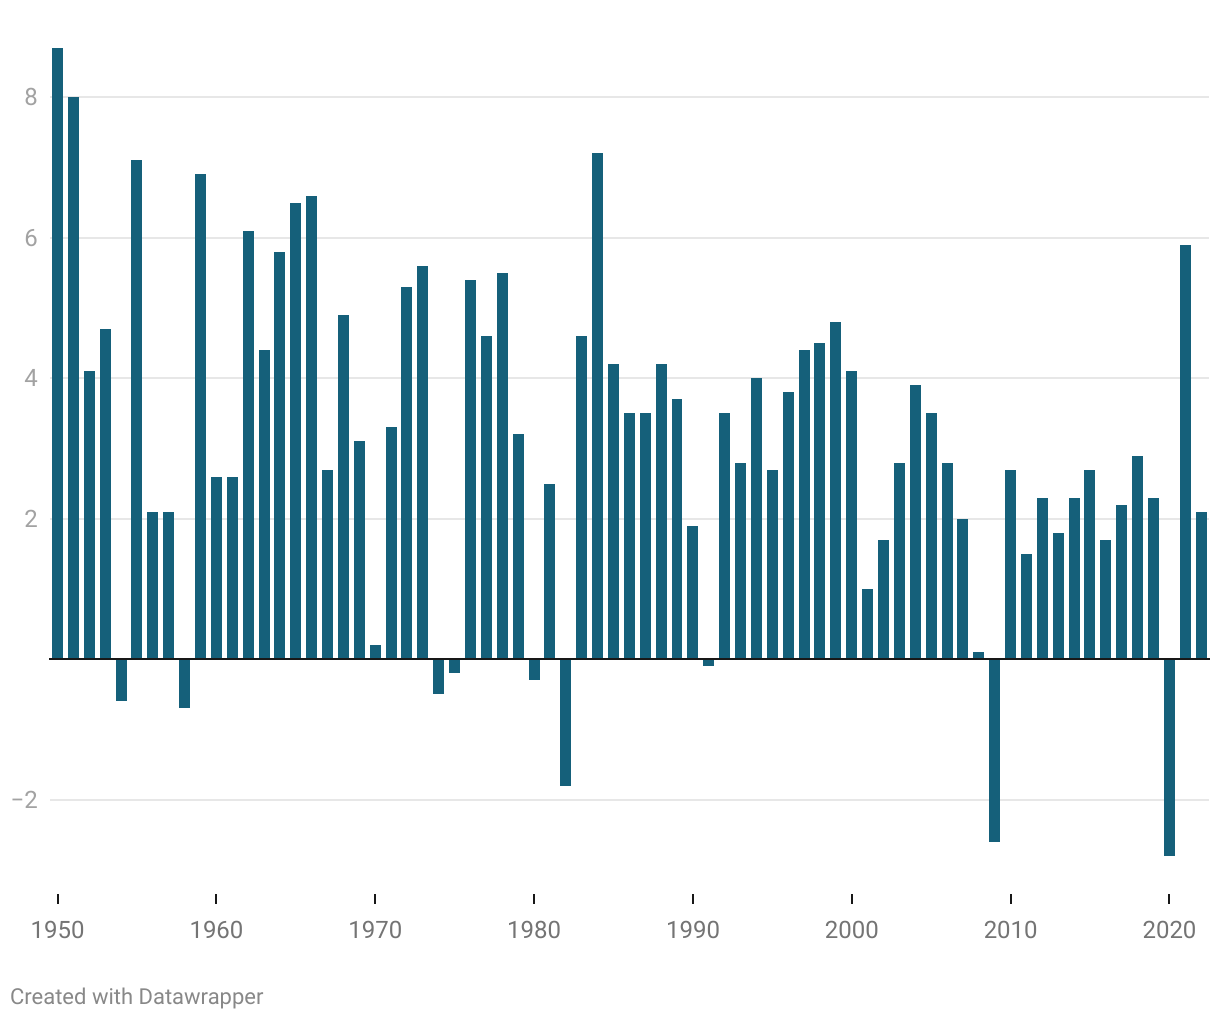
Figure 2 – US annual real GDP growth
Year-by-year % growth, seasonally adjusted annualized rate
This bar chart displays US yearly GDP growth percent from 1950 (8.7%) to 2022 (2.1%). The values range from 8.7% in 1950 to negative 2.8% in 2020. While the values do vary year-to-year, the general trend across the chart demonstrates a fairly steady decline in GDP growth rate over time.