Gay and Lesbian Acceptance Post-Legalization Typically Outpaced Increases in Acceptance of Other Minorities
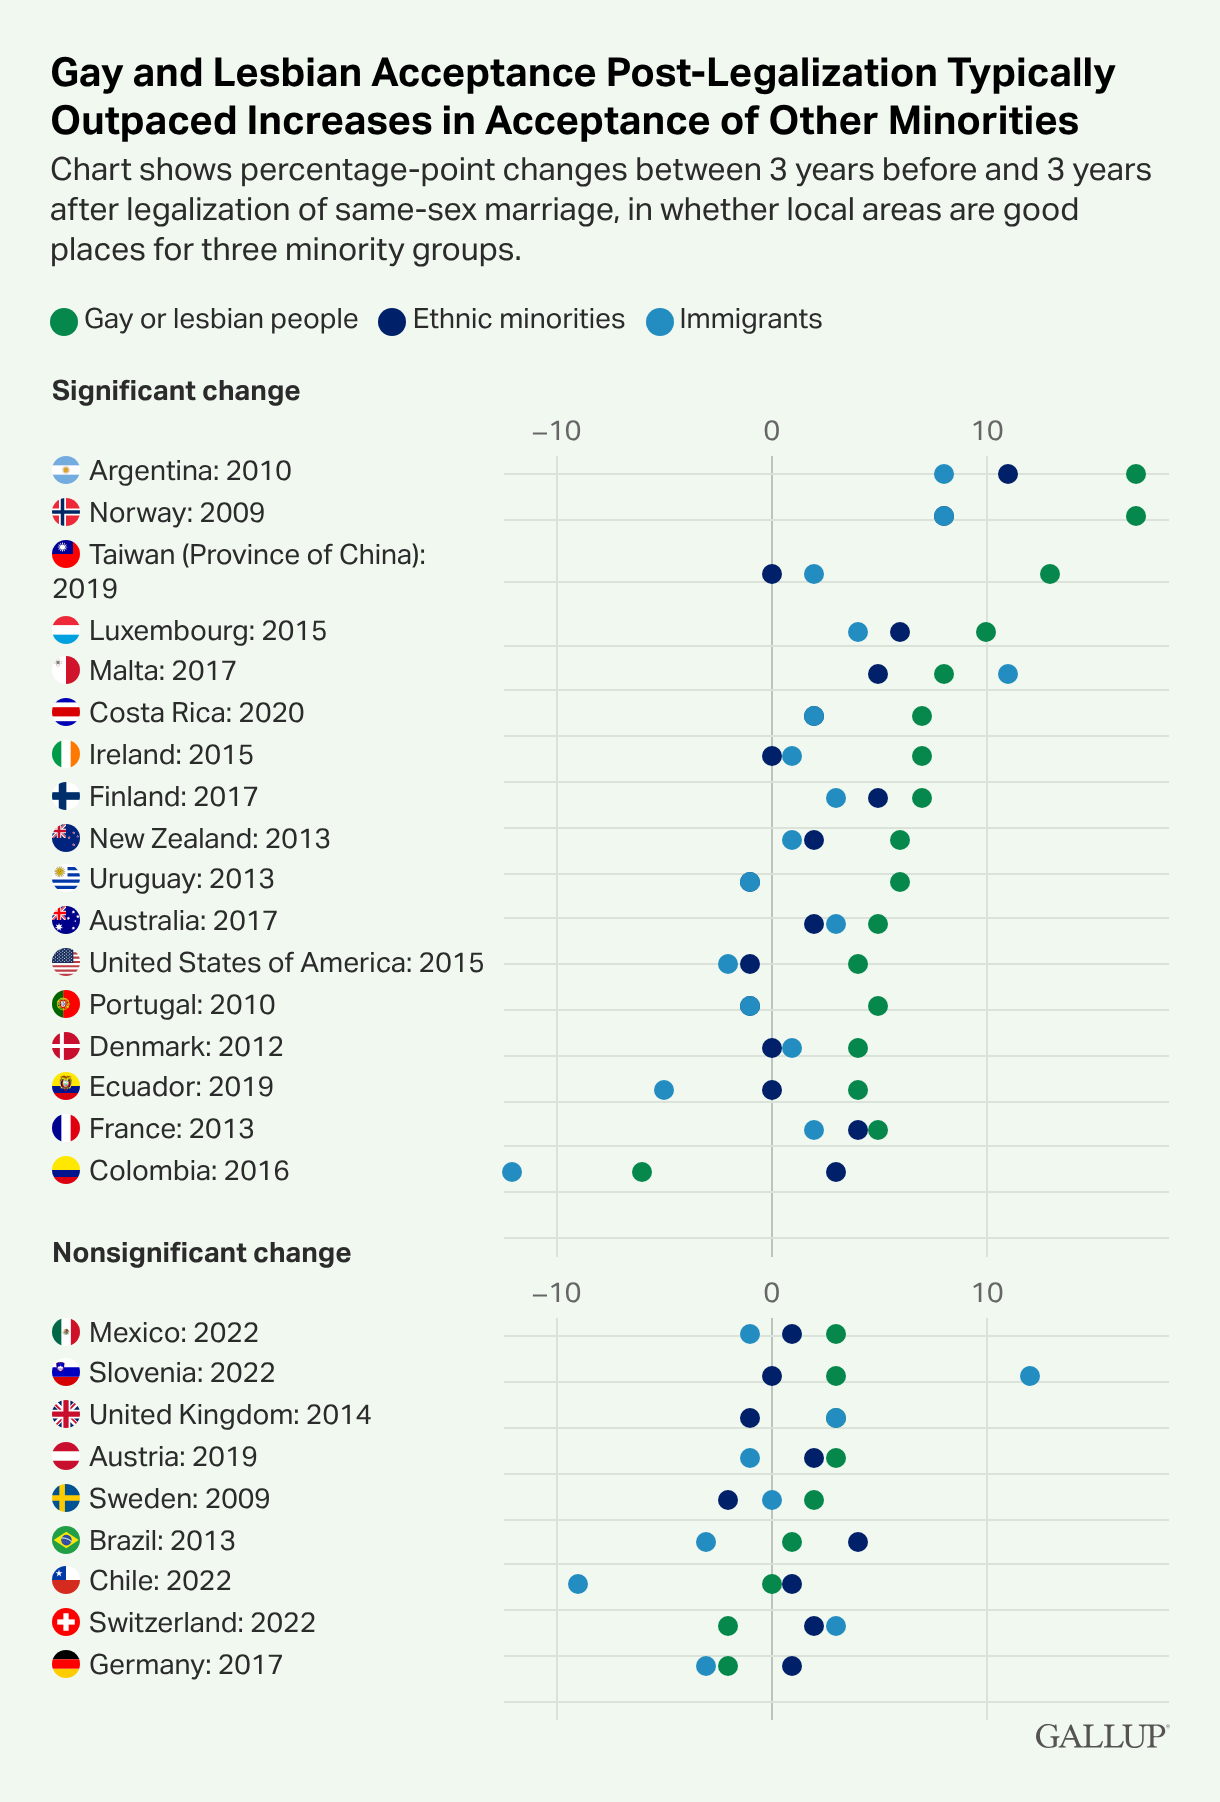
Chart shows percentage-point changes between 3 years before and 3 years after legalization of same-sex marriage, in whether local areas are good places for three minority groups.
Dot plot showing percentage-point changes in perceptions that local areas are good places to live for gay and lesbian people, ethnic minorities and immigrants after same-sex marriage legalization (comparing the % "good place" sentiment in the three calendar years before legalization and the three calendar years after the year of legalization). In countries with significant change, gains for gay and lesbian people are generally larger and more consistent than gains for ethnic minorities or immigrants, while countries with nonsignificant change show little overall movement across groups.
