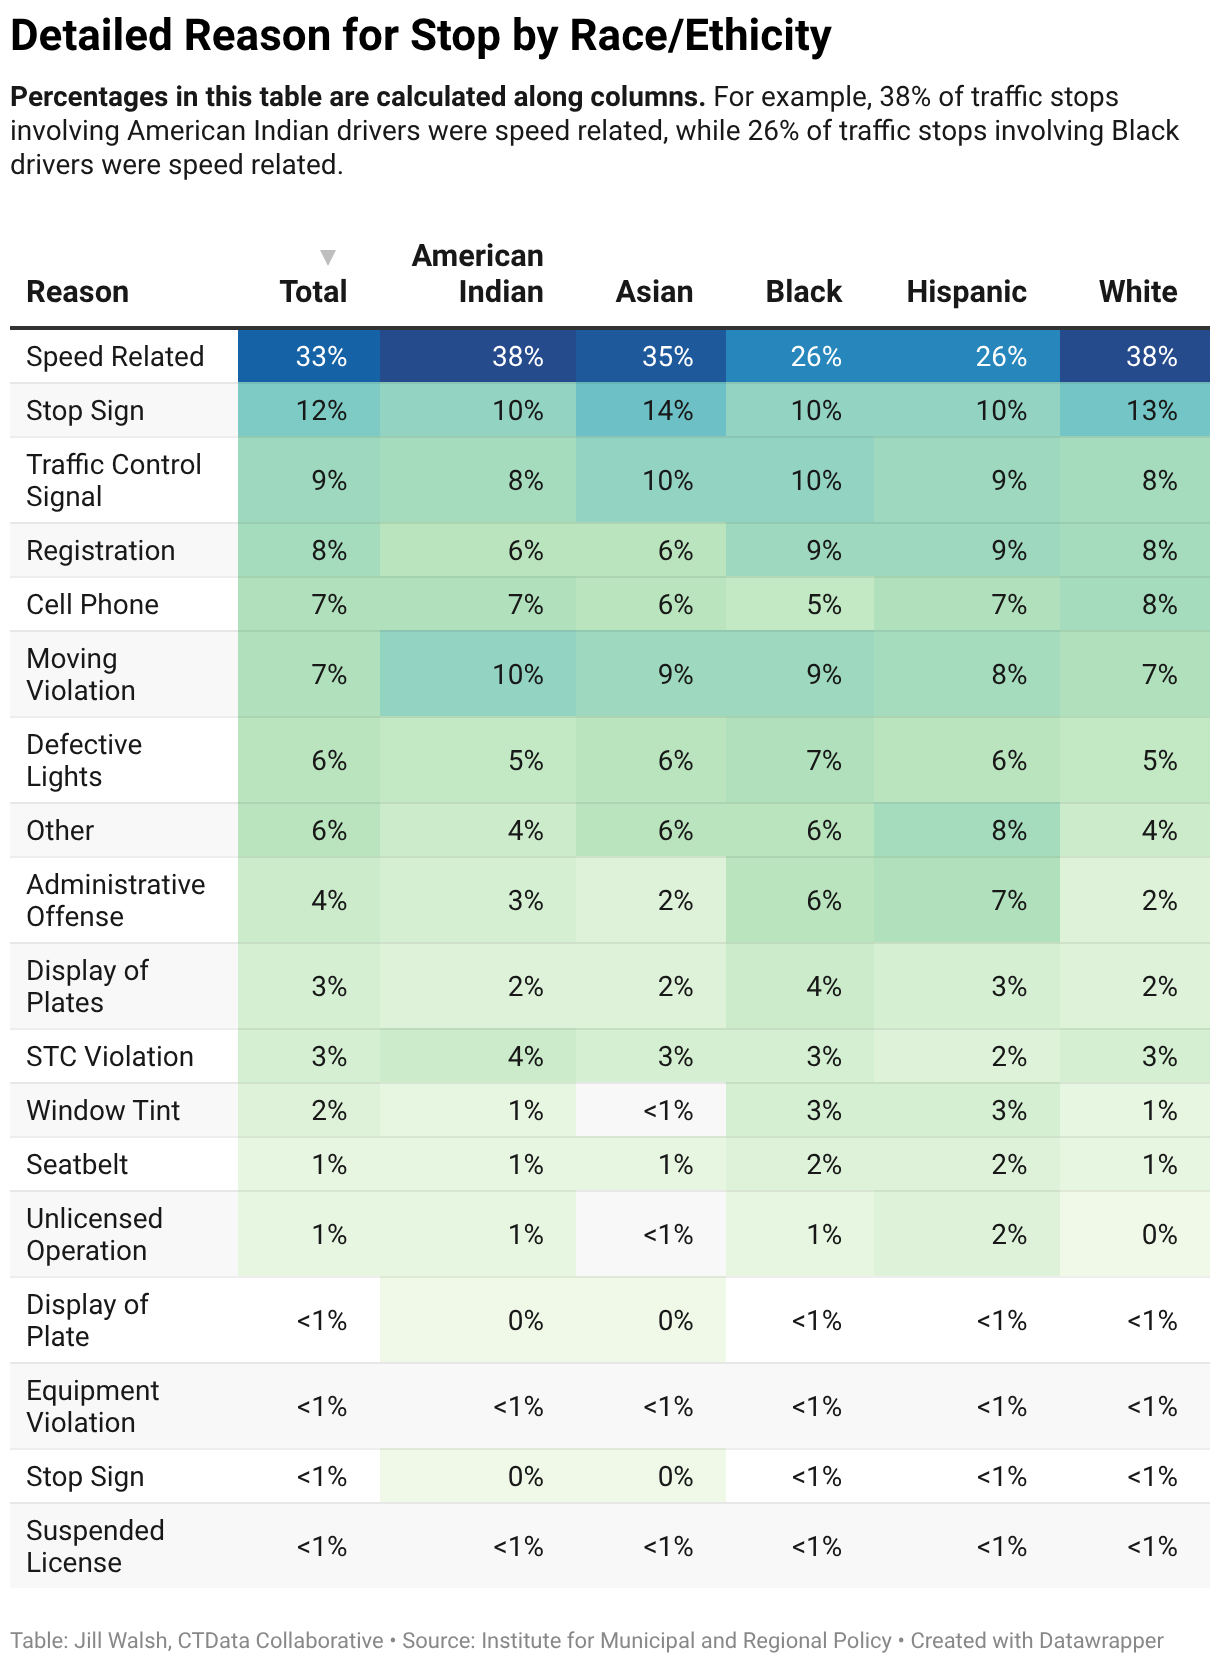
Detailed Reason for Stop by Race/Ethicity
Percentages in this table are calculated along columns. For example, 38% of traffic stops involving American Indian drivers were speed related, while 26% of traffic stops involving Black drivers were speed related.