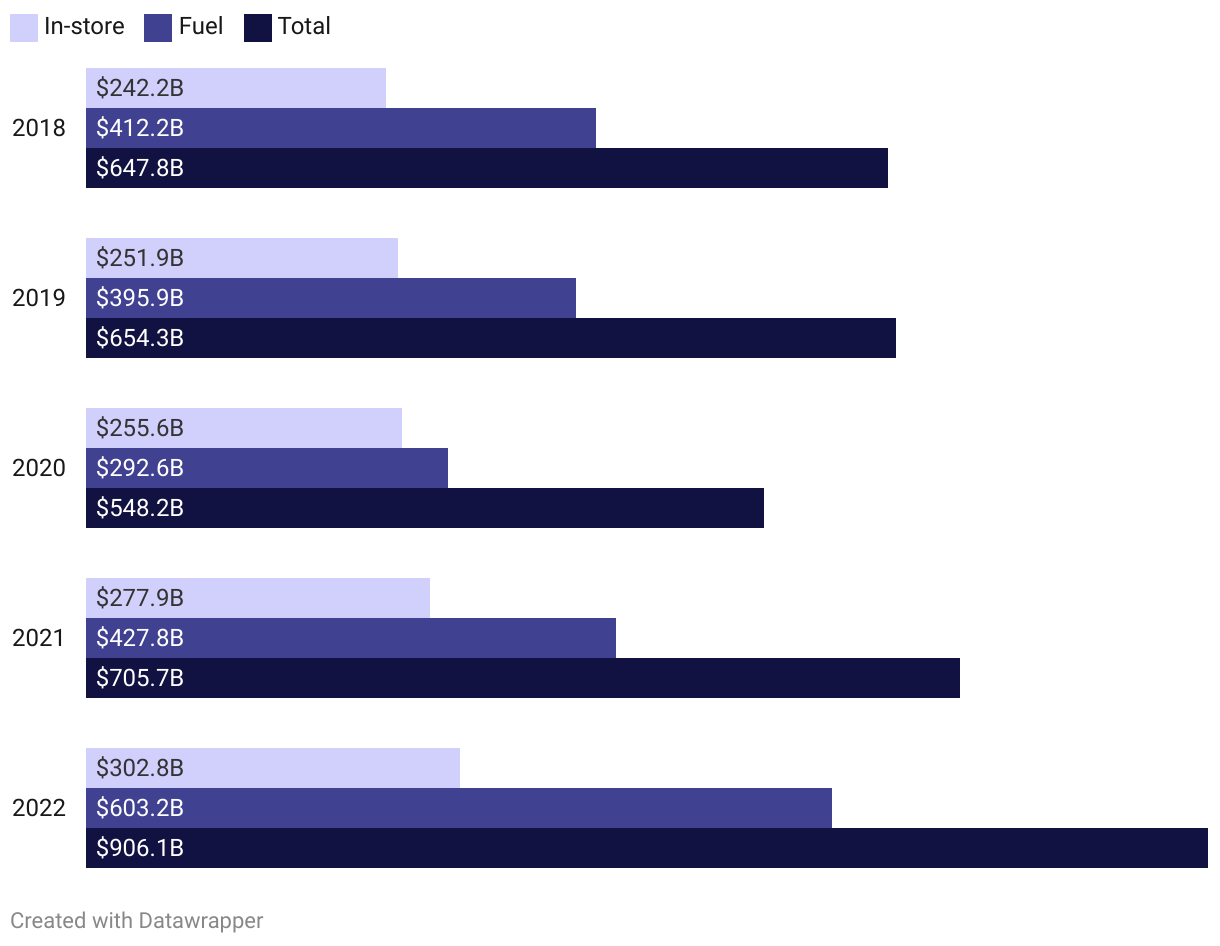
A bar chart showing the in-store, fuel and total c-store sales by year from 2018 through 2022, showing that 2022's numbers are larger than previous years.
(Please use a modern browser to see the interactive version of this visualization)