Most Popular Chart Types Ranking
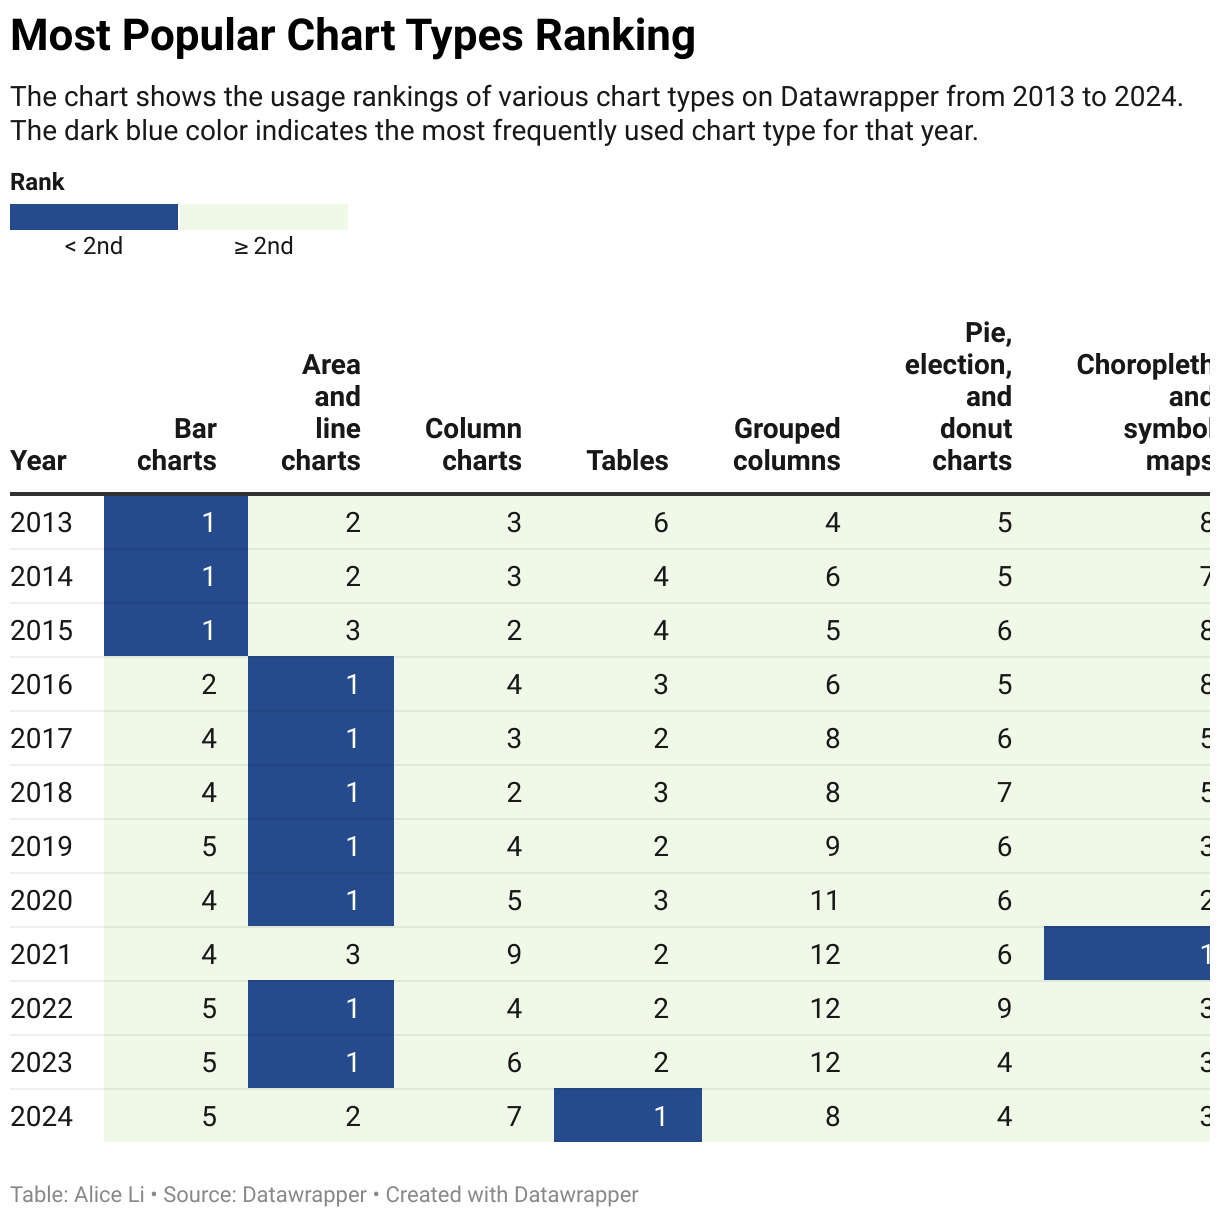
The chart shows the usage rankings of various chart types on Datawrapper from 2013 to 2024. The dark blue color indicates the most frequently used chart type for that year.
The chart shows the usage rankings of various chart types on Datawrapper from 2013 to 2024. The dark blue color indicates the most frequently used chart type for that year.
