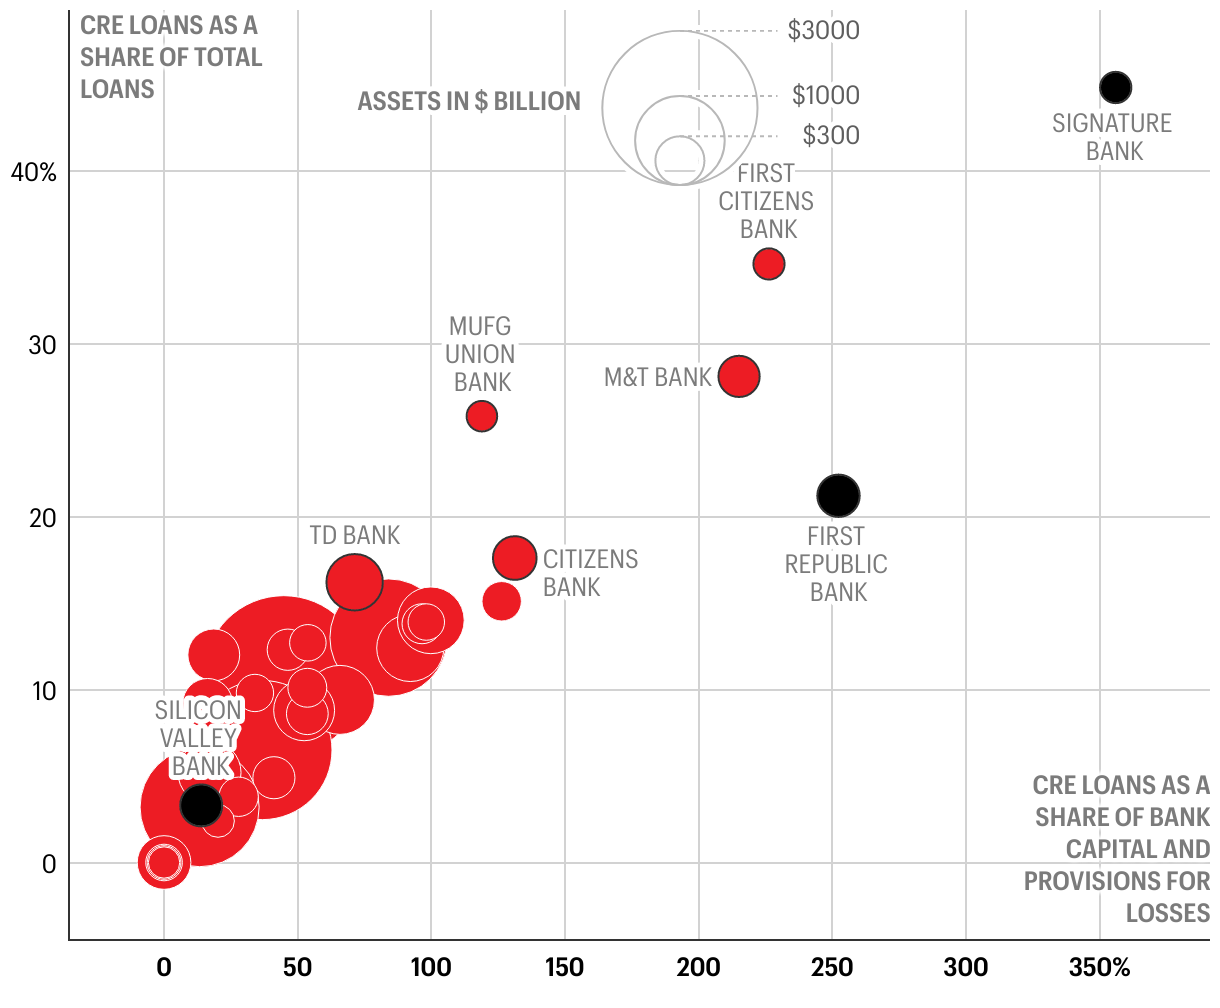
BANKS’ COMMERCIAL REAL ESTATE EXPOSURE
The higher and farther to the right a bank appears, the greater its exposure. Data is of Q4 2022; three banks represented by black circles have gone under since then.
Chart shows U.S. banks exposure to commercial real estate